Benarido Amri [2106718230]
Calculation of wind turbine power generation system:
Wind Turbine Energy Calculator
Output:
The wind turbine system is to be used for supplying electricity for the DAIS ecosystem, with the flowchart of the system as shown below:
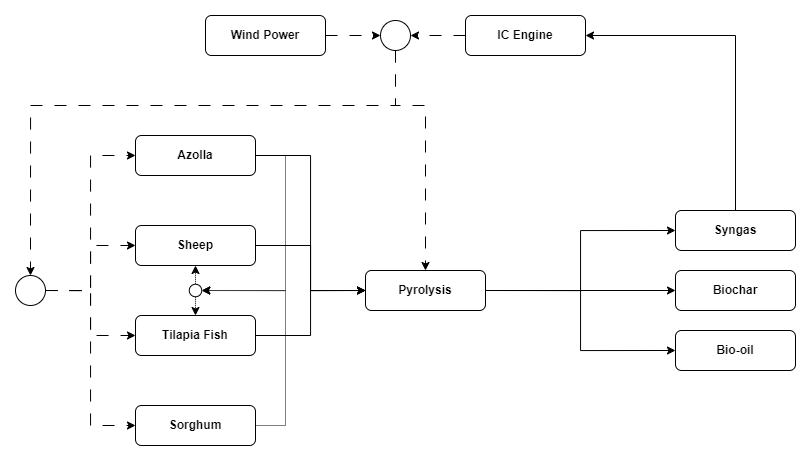
The power generation calculation will ultimately be based on the overall power requirement of the system, which are to support the growth and sustain the azolla, sheep, tilapia fish, and sorghum systems.
Calculation of power requirement:
Power Requirement Calculator
Total Power Requirement: 0 Watts
Update Friday, 28/02/2025
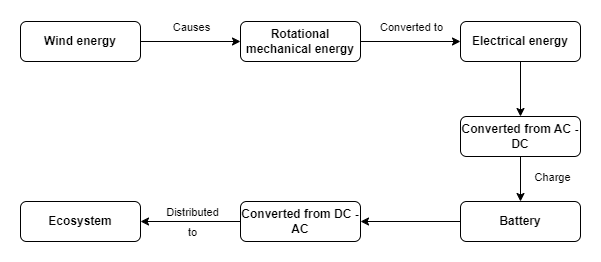
To help visualize the conversion system from wind power to electricity, a flowchart is used:
Furthermore, assuming each of the resources as well as the pyrolysis require power of 2250 W. Using the calculator (calculation of power requirement) above, the amount of power needed to be generated by the turbines would be 9000 W.
The assumption of power requirement is based on the resource of Tilapia fish, at a 6m diameter pond containing 900 fishes.
Update Tuesday, 04/03/2025
Calculation of Turbine Blade Diameter:
Wind Turbine Blade Diameter Calculator
System Efficiencies (%)
Blade Diameter: — meters
Update Friday, 14/03/2025 and Tuesday, 18/03/2025
A simulation of the DAIS building is conducted using Simscale (https://www.simscale.com/) in order to find the ideal placement for the wind turbine system since in urban areas, the wind condition is generally not ideal for a wind turbine system, therefore, it is important to optimize the placement of the wind turbine to obtain the highest power generation potential. The simulations are based on the assumptions below:
- Incompressible flow
- Bounding box is around 20 m on either side and 20, 40 m on the front and back.
- The wind velocity inlet is set constant at 4 m/s
- The wind is travelling from the front of the building to the back.
- The back is set as pressure outlet with gage pressure of 0 Pa.
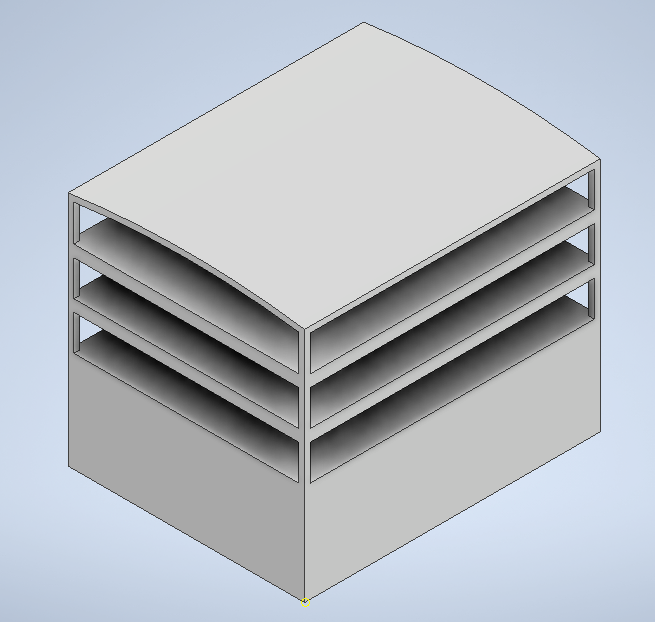
The above figure shows the geometry of the building used in the simulation. The building is a rectangular box of (20x25x20) m in size, with the rooftop slightly curved (on the second simulation).
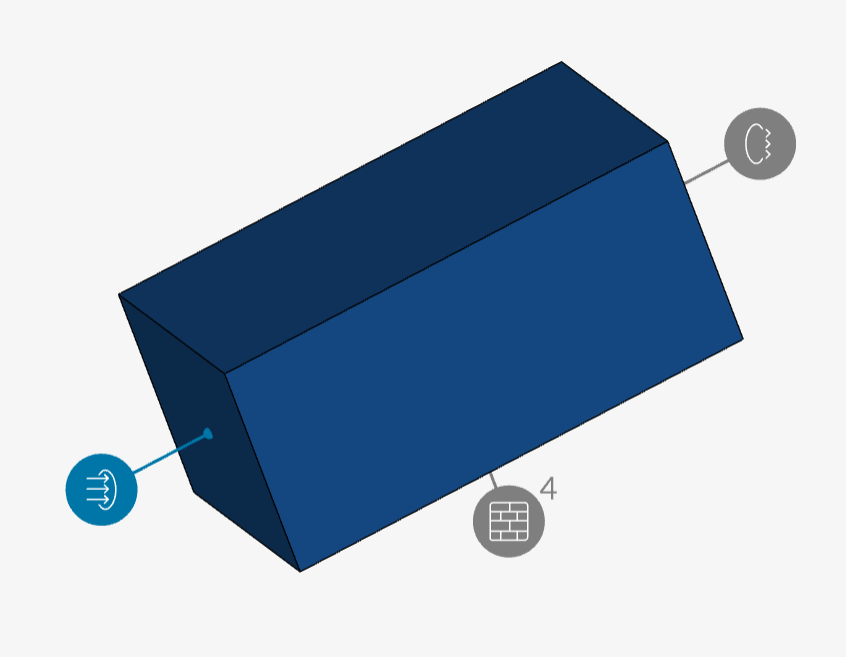
The bounding box for the simulation is made larger than the geometry of the building, this is purposefully done to ensure all the velocity fields are visible. The above figure describes the boundary condition of the simulation, with the front part of the building as the velocity inlet, the back of the building as pressure outlet, and the sides of the box as walls.
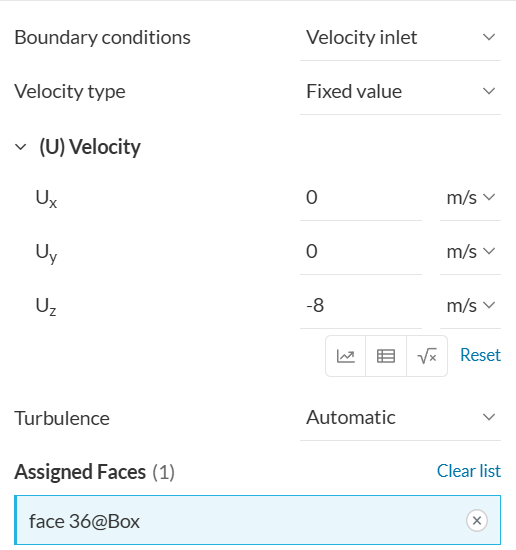
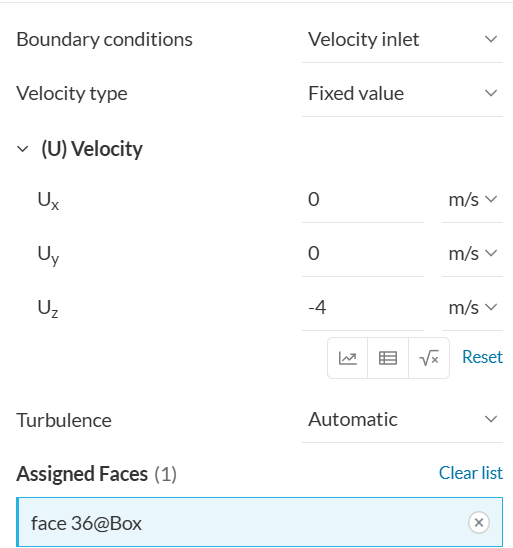
Two simulations were conducted with slightly different geometries and wind condition, to figure out what affect does the rooftop geometry has on the wind velocity magnitude. The first simulation is using a wind velocity of 4 m/s from the front to the back of the building with a flat rooftop, and the second simulation is 8 m/s of the same direction with a curved/arched rooftop.
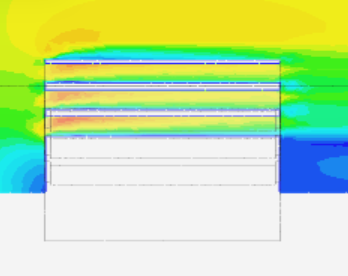
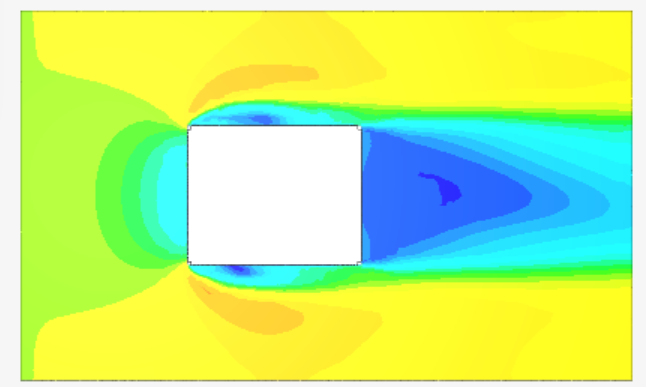
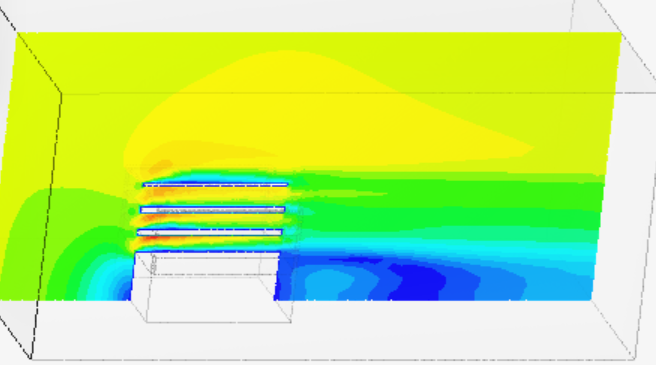
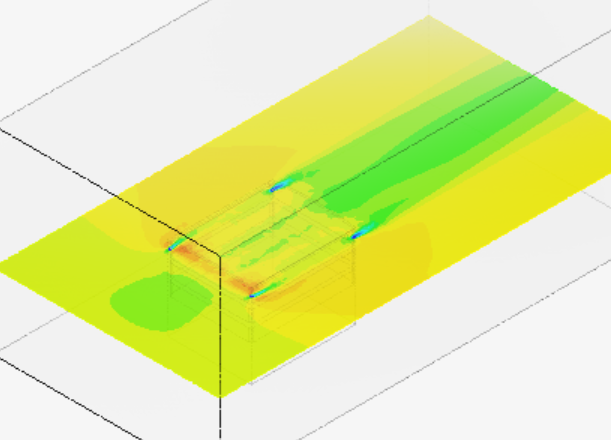
The above two figures are the obtained result of the simulation. The top figure shows the velocity magnitude plane from the side of the building and the bottom figure shows the velocity magnitude plane from the top of the building.
Several regions of wind velocity can be observed depending on the location relative to the building. High velocity regions are present at the sides and top of the building, as well as at the top of each open floor.
Meanwhile, a lower velocity region is observed at the back of the building, and also close to the surfaces of the building.
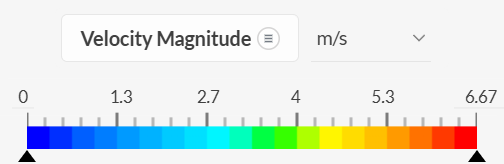
The higher velocity regions reach speeds of up to 6.7 m/s which is an increase of about 67.5 % from the initial wind velocity. Whilst the lower velocity regions can reach speeds of 0.
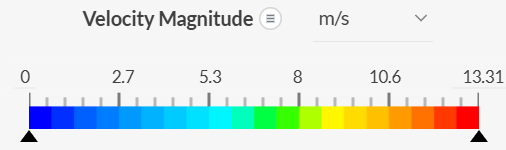
The figures above represent the velocity profile around the building with the new geometry and higher speeds. A similar pattern of high and low velocity regions can be observed. The increase of the high velocity region is relatively similar to the first simulation of 66.4 %.
The increase in speed can be explained (with simplification) where when an area decreases the velocity will increase:
Qi = Qo
Vi * Ai = Vo * Ao
To conclude, based on the velocity profile of the building, it would be beneficial if the wind turbine blades are placed at the top of each of the open floors and at the rooftop. It is also important to ensure enough space between the rooftop and the wind turbine blade as there is a low velocity region close to the topside of the roof. Additionally, it would be better to avoid places at the back side of the building.
Update Friday, 21/03/2025
Another simulation is conducted using simscale, however, the current simulation focuses on the thermal analysis of the DAIS pyrolysis system. Which is to create a reactor and heater design which can produce an even heat distribution for the reactor.
To achieve this a cylindrical design model is created using CAD Autodesk Inventor software with two designs:
- Cylindrical device without interior fins
- Cylindrical device with interior fins
These experiment hope to simulate the effect of fins on the temperature distribution of the reactor.
Design Model:
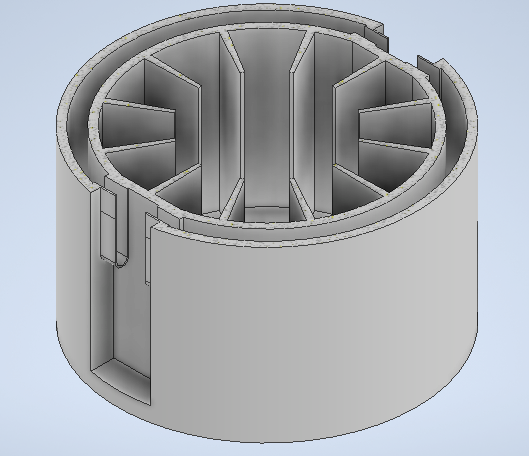
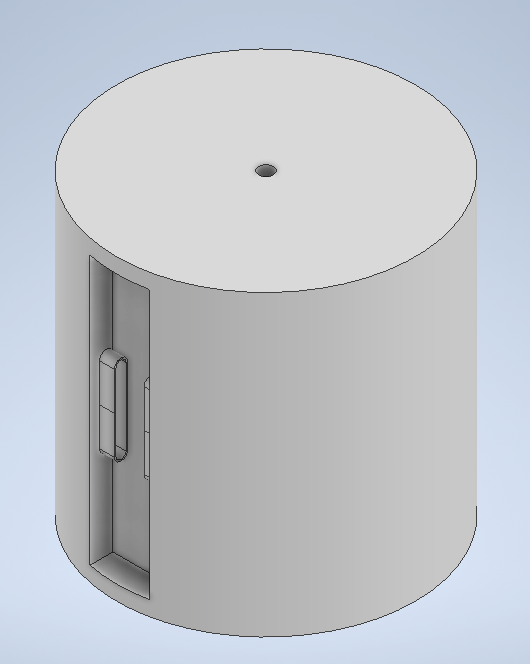
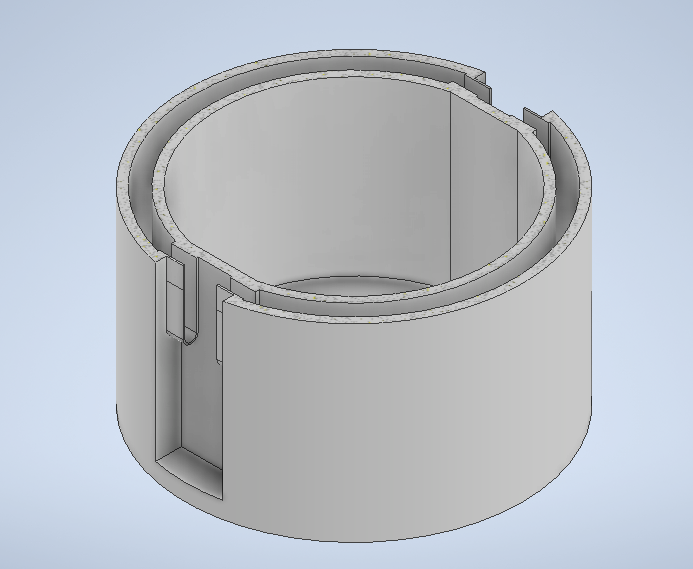
The first figure is the CAD model of the cylindrical device with interior fins whilst the third figure represents the cylindrical device without interior fins. The second figure shows the external design of the device.
Specifications:
The cylinder is 1 m in diameter and 1 m in height. With the size of the reactor at 0.8 m in diameter and 0.9 m in height. Each of the device have 2 inlet and outlet for the exhaust gas. The device is made using aluminum.
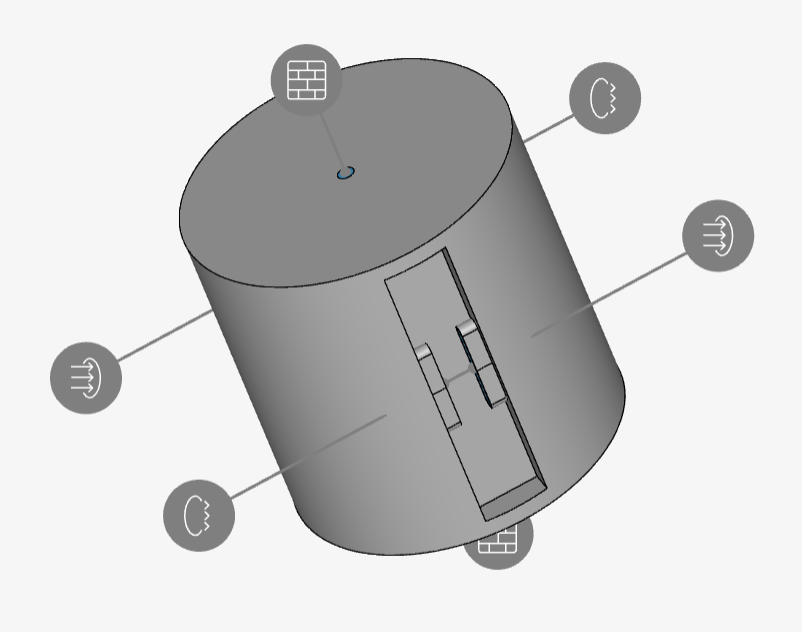
Assumptions:
- Mesh is set at setting 6, automatic.
- End time is at 80 s, with delta time of 1 s and rite interval of 4.
- The top and bottom holes are assumed to be adiabatic walls.
- Material of the solid is an aluminum with thermal conductivity of 235 W/(m*K).
- The inlet velocity is set to 0.5 m/s (this velocity is very low when compared to the typical engine exhaust of about 20 m/s.)
Results (Without interior fins):
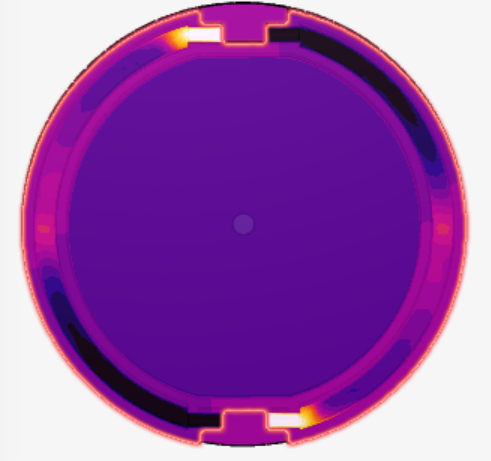
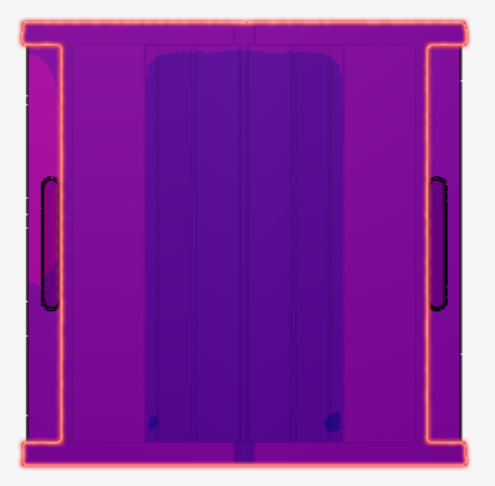
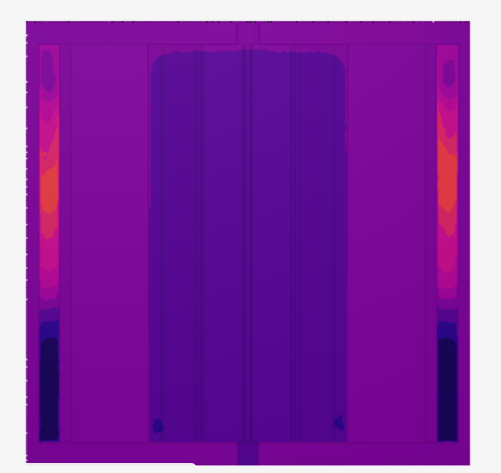
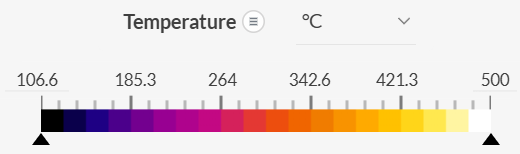
The temperature distribution shows a distinct area of the inlets which are at the bottom right, and top left section of the figure above. It also shows a relatively higher temperature region at the 3 and 9 clock position. The area in the middle (reactor) shows a relatively consistent and even temperature distribution, with temperature of around 175 degree Celsius, however this result may not represent the actual condition due to the reactor temperature being too even.

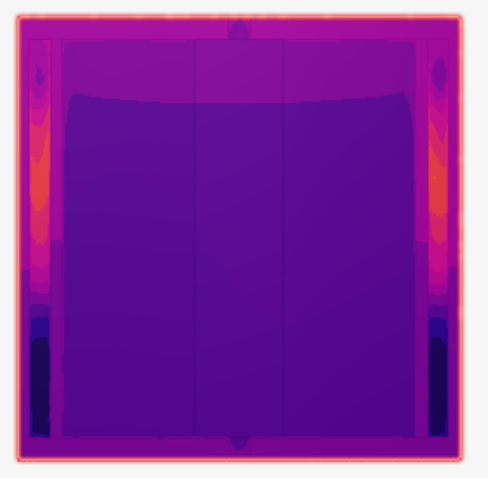
Observing the device from the sides seem to show the temperature distribution of the reactor separated into 2 main region with the upper region reaching a higher temperature of around 185 degree Celsius, and the lower region with temperature of 175 degree Celsius. This is also consistent with the temperature region of the heating chamber.
Results (With interior fins):
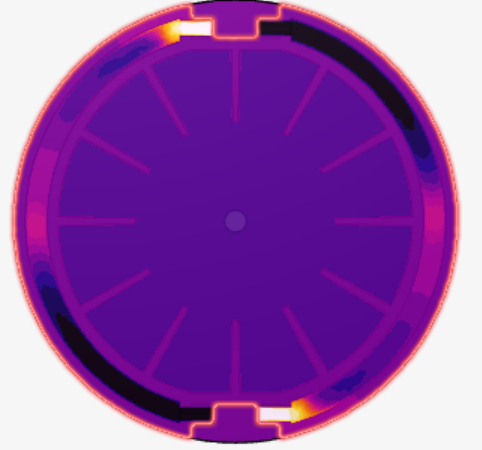
The simulation of the pyrolysis device with fins shows a lower average temperature of the reactor at 173 degree Celsius. Which is quite an unexpected result. However, the fins are at a temperature higher around the same area compared to the previous simulation, with a value of 190 degree Celsius.
When observing the temperature distribution from the sides, the fins seem to eliminate the uneven temperature distribution between the upper and lower layer.
One response to “Benarido Amri [2106718230]”
Sustainable energy conversion system is the process of transforming renewable resources such as biomass, hydro, solar energy into electricity. Sustainable energy focuses more on generating a long-term ecological balance and minimizing harm to the environment.
These systems need to be implemented to maintain non-renewable resources such as coal or oil, lower carbon emissions which causes climate change, support economic growth.
One of the promising resources for sustainable energy is biomass, due to its versatility, which is able to be converted into biofuel, biogas, or electricity. Biomass can originate from a diverse sources such as agricultural waste, forest products, or animal waste.