Assalamualaikum Wr. Wb. Hello everyone, my name is Vegantra Amayko Siaga. Today i want to share my result of CFD Simulation of the 5 floor bulding project with simscale
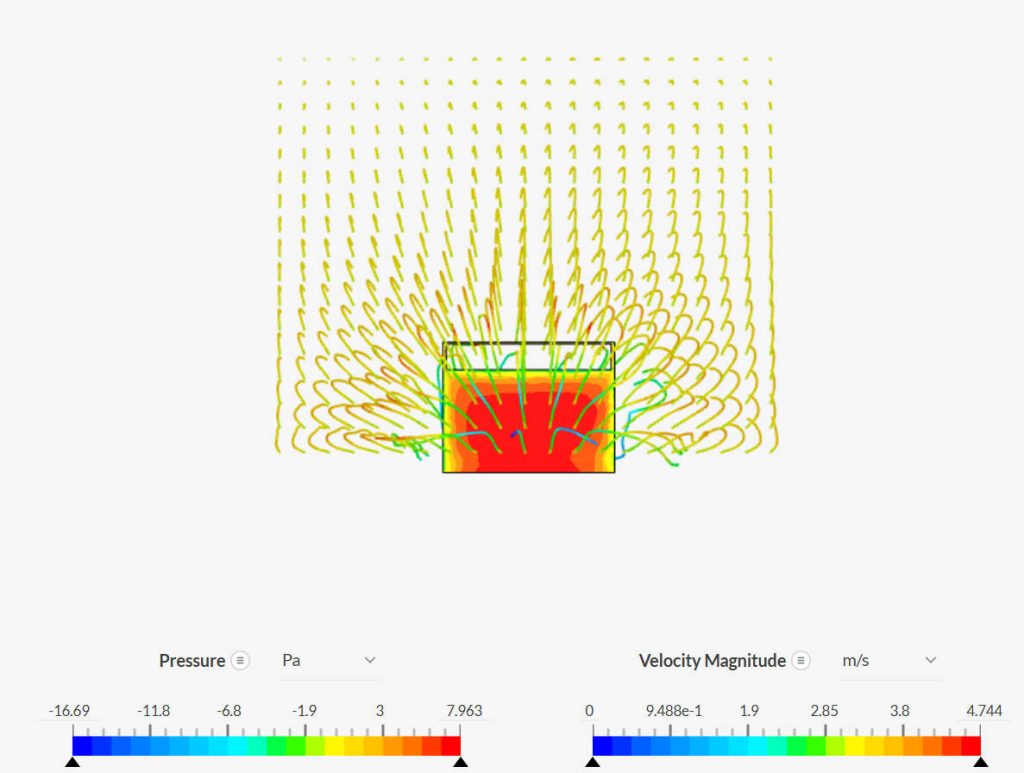
- A frontal view highlights high-pressure accumulation at the front facade due to direct wind impact.
- Streamlines curve outward, showing airflow deflection to both sides and upward over the roof.
- Recirculation zones are visible near the base behind the building, where airflow reverses direction.
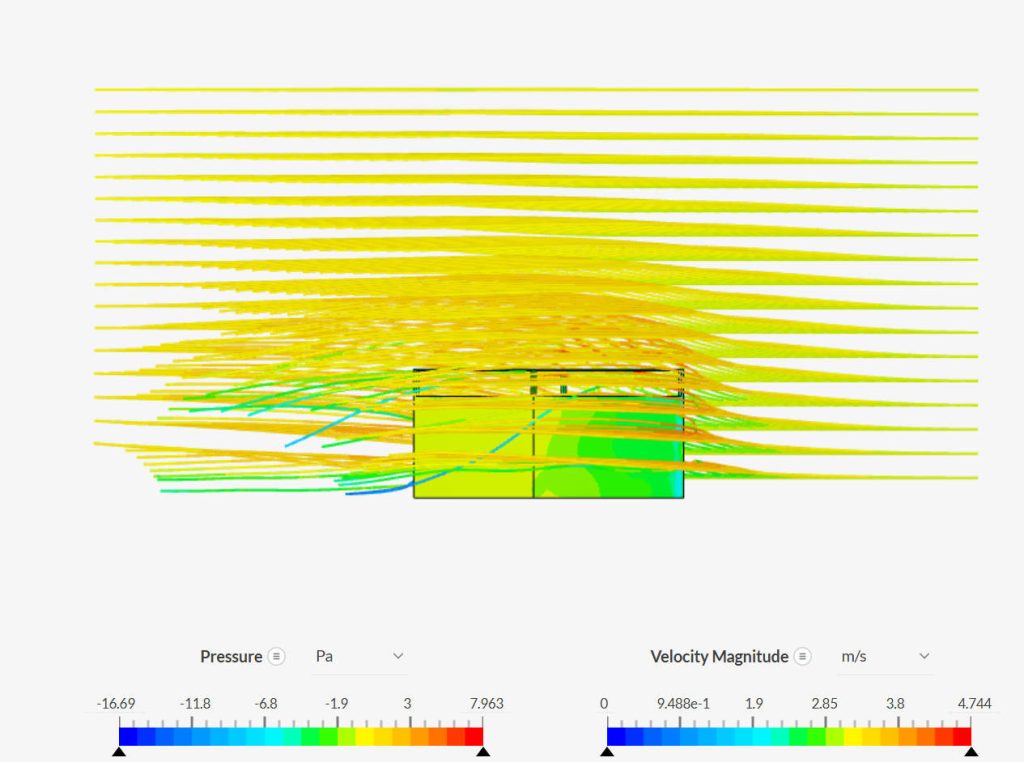
- This side view shows horizontal airflow interacting with the building.
- Streamlines indicate deflection and acceleration of air over and around the structure.
- A noticeable reduction in velocity occurs behind the building, creating a wake zone with low-pressure regions.
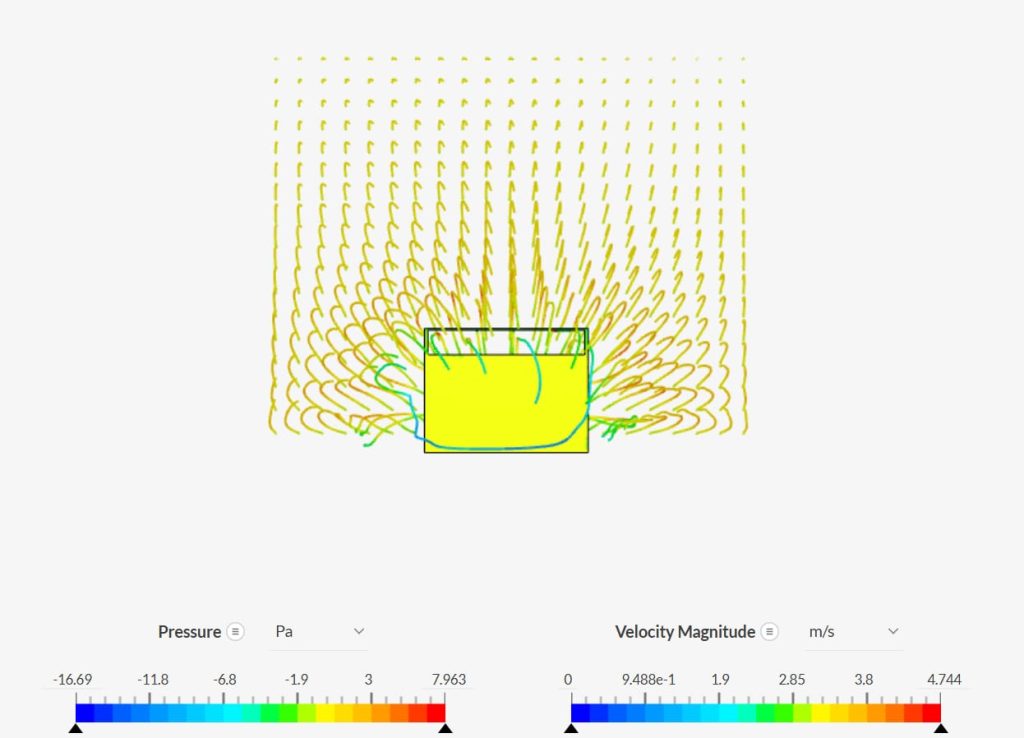
- Similar to Image 2 but with a clearer focus on recirculation patterns behind the building.
- The wake zone is characterized by low velocities and turbulent flow, which can affect thermal comfort and air quality in this area.
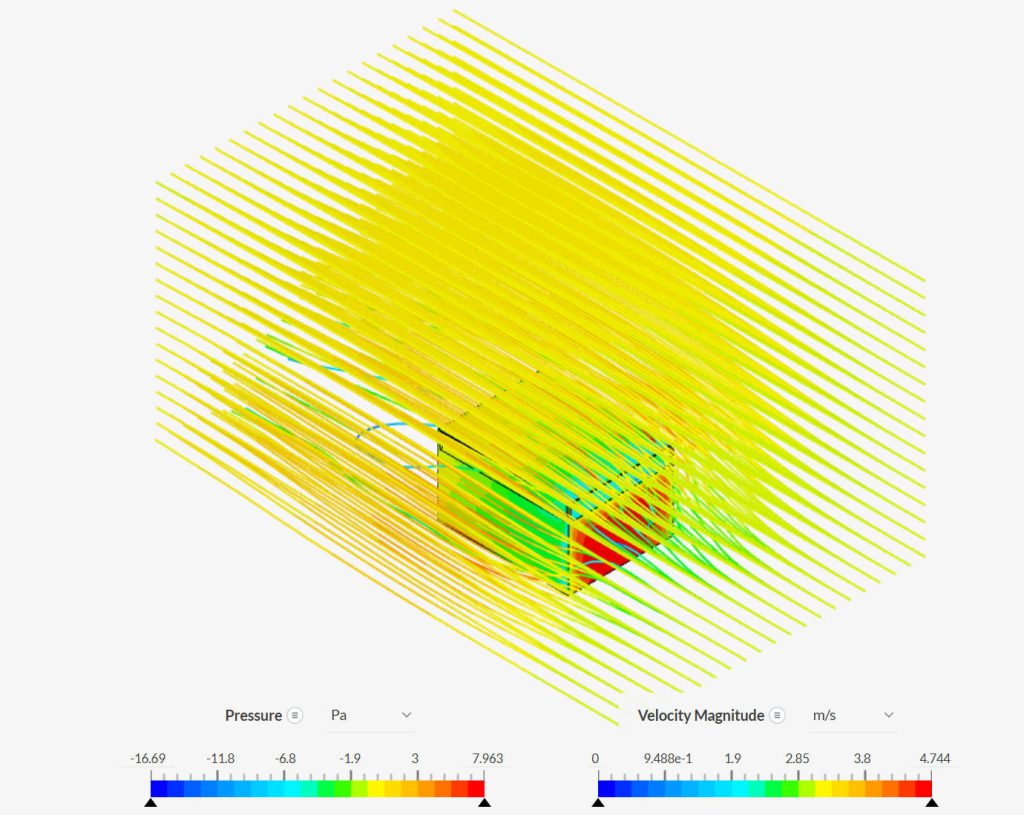
- A three-dimensional perspective shows airflow behavior around all sides of the building.
- High-speed airflow is diverted over and around the structure, while slower velocities dominate near its base and rear.
General Observations
- Pressure Distribution (Pa):
- The pressure scale ranges from -16.69 Pa to 7.963 Pa, indicating areas of low and high pressure.
- Low-pressure zones (blue) are observed behind the building, likely due to wind flow separation and turbulence.
- High-pressure zones (red/orange) are concentrated at the front of the building, where the airflow directly impacts the structure.
- Velocity Magnitude (m/s):
- The velocity scale ranges from 0 m/s to 4.744 m/s.
- Higher wind speeds (yellow/red) occur above and around the building, while lower speeds (green/blue) are seen near the base and behind it, indicating areas of stagnation or recirculation.