Ahmad Firial Kardias
Department of Mechanical Engineering, Universitas Indonesia, Depok, Indonesia
ABSTRACT
Solar photovoltaic (PV) modules suffer significant efficiency losses due to elevated cell temperatures, with electrical performance degrading by approximately 0.4%–0.5% per degree Celsius above standard test conditions. This study presents a comprehensive three-dimensional transient Computational Fluid Dynamics (CFD) investigation evaluating a novel biomimetic Leaf Vein T-Shaped (LVT) fin configuration for the passive thermal management of monocrystalline PV modules. Three distinct extended surface geometries are systematically analyzed and compared: standard Parallel Fins (PAR), conventional Leaf Vein Fins (LV), and the newly proposed Leaf Vein T-Shaped Fins (LVT). Simulations are conducted under tropical coastal boundary conditions representative of Indonesia (1000 W/m² irradiance, 5 m/s wind speed, ambient temperature 30°C) using the k–ω SST turbulence model with the Finite Volume Method. The results demonstrate that the LVT configuration achieves exceptional thermal mitigation, reducing the average cell operating temperature from an uncooled baseline of 64.15°C down to 43.10°C, and compressing the maximum longitudinal thermal gradient from 24.8°C (PAR) to a mere 6.70°C. Consequently, the absolute electrical conversion efficiency of the monocrystalline module rises to 14.24%, yielding an 11.51% net power output enhancement over the uncooled module—substantially outperforming the PAR (+5.87%) and LV (+8.77%) designs. Indicative techno-economic and environmental analysis further confirms a distinct reduction in Levelized Cost of Electricity (LCOE) and mitigation of approximately 96.8 metric tons of CO₂-eq per megawatt-annum in fossil-intensive grid environments. These findings establish the LVT architecture as a highly competitive paradigm for passive thermal management of high-performance solar energy assets in tropical environments.
Keywords: Passive cooling; Photovoltaic thermal management; Leaf vein fins; Biomimetic heat sink; T-shaped fins; CFD; Natural convection; Renewable energy; Tropical climate
1. INTRODUCTION
The global transition toward sustainable energy infrastructure has cemented solar photovoltaic (PV) technology as a dominant renewable resource. However, the operational efficiency of monocrystalline and polycrystalline silicon modules is fundamentally constrained by their intrinsic thermal sensitivity. A substantial portion of incident solar irradiance—often exceeding 80%—is absorbed as thermal energy rather than being converted into electricity, leading to inevitably elevated cell temperatures. Consequently, as established by Skoplaki and Palyvos [1], the electrical conversion efficiency degrades by approximately 0.4% to 0.5% for every degree Celsius increase above standard test conditions. Prolonged exposure to such thermal stress not only diminishes the instantaneous power yield but also accelerates the thermomechanical degradation of the photovoltaic encapsulation, thereby threatening the system’s long-term operational viability [2].
To mitigate these adverse thermal effects, extensive research has been directed toward developing effective thermal management systems. While active cooling techniques—such as forced fluid circulation or mechanical convective systems—demonstrate high heat removal capacities, their reliance on external parasitic power, coupled with increased maintenance and system complexity, often offsets the net energetic gains [2]. As a result, passive cooling mechanisms utilizing extended surfaces (fins) have garnered significant attention. Elbreki et al. [3] highlighted that passive heat dissipation approaches represent a more sustainable and reliable solution due to their zero-energy consumption and cost-effectiveness. Consequently, computational fluid dynamics (CFD) investigations have extensively analyzed conventional fin geometries to maximize convective heat transfer. Geometric modifications, such as utilizing trapezoidal profiles or adjusting fin spacing, have proven to be critical determinants in disrupting thermal boundary layers and enhancing the convective heat transfer coefficient [4].
In the pursuit of maximizing heat dissipation while minimizing material volume, recent advancements have increasingly drawn inspiration from nature. Biomimetic architectures, particularly leaf vein-inspired patterns, offer superior fluid flow distribution by mimicking natural vascular networks. Recent computational studies have demonstrated that reticulate and pinnate leaf vein fins significantly outperform standard linear parallel configurations by maximizing air contact and breaking thermal boundary layers [5]. In parallel research, the integration of T-shaped branching and specific cavity designs in heat sinks has proven highly effective in enhancing thermal diffusion and temperature uniformity, particularly when coupled with phase change materials (PCM) [6, 7].
Despite these individual geometric advancements, a prominent gap remains in the existing literature regarding the synergistic integration of biomimetic leaf vein architectures with T-shaped bifurcations specifically designed for natural convective air cooling. Most existing models evaluate either straight parallel arrays or purely fractal branching without incorporating the specific flow-disrupting capabilities of T-shaped secondary extensions. The addition of T-shaped elements to a primary leaf-vein structure is theorized to create localized vortex generators that further disrupt the thermal boundary layer, preventing the stagnation of heated air that typically occurs in conventional linear fin channels. To address this specific research gap, the present study proposes a novel hybrid fin architecture: the leaf vein T-shaped fin. This research conducts a comprehensive three-dimensional CFD investigation to evaluate and compare the thermal and electrical performance of a PV module
integrated with three distinct extended surface configurations: standard parallel fins, conventional leaf vein fins, and the newly proposed leaf vein T-shaped fins. The primary hypothesis asserts that the incorporation of T-shaped bifurcations into a leaf vein framework will induce localized turbulence and promote a more uniform thermal distribution. This mechanism is expected to result in superior temperature reduction and higher electrical efficiency compared to the standard parallel and conventional leaf vein designs. By systematically analyzing the fluid dynamics and heat transfer characteristics of these geometries, this paper aims to provide a robust theoretical foundation and a new geometric optimization pathway for the passive thermal management of high-performance solar photovoltaic systems.
2. METHODOLOGY
2.1 Physical Model and System Description
The proposed passive cooling system is designed to dissipate the accumulated thermal energy from the rear surface of a standard photovoltaic (PV) module. The PV panel consists of five primary layers: a glass cover, an upper Ethylene Vinyl Acetate (EVA) encapsulant, the silicon solar cells, a lower EVA layer, and a Tedlar backsheet [8]. To facilitate an effective conductive heat transfer path, an aluminum base plate is affixed to the Tedlar layer. Aluminum is selected due to its high thermal conductivity (k ≈ 205 W/m·K) and low density, which is critical for minimizing the structural load on the PV array [9]. Extending from this base plate are three distinct fin configurations designed for natural convection cooling: Parallel Fins (PAR), Leaf Vein Fins (LV), and Leaf Vein T-Shaped Fins (LVT).
To ensure a rigorous comparative analysis, the volume of the material and the fundamental macroscopic dimensions of the heat sinks are maintained as consistent parameters across all configurations. The detailed geometric specifications and their theoretical aerodynamic mechanisms are elaborated in the subsequent sections.
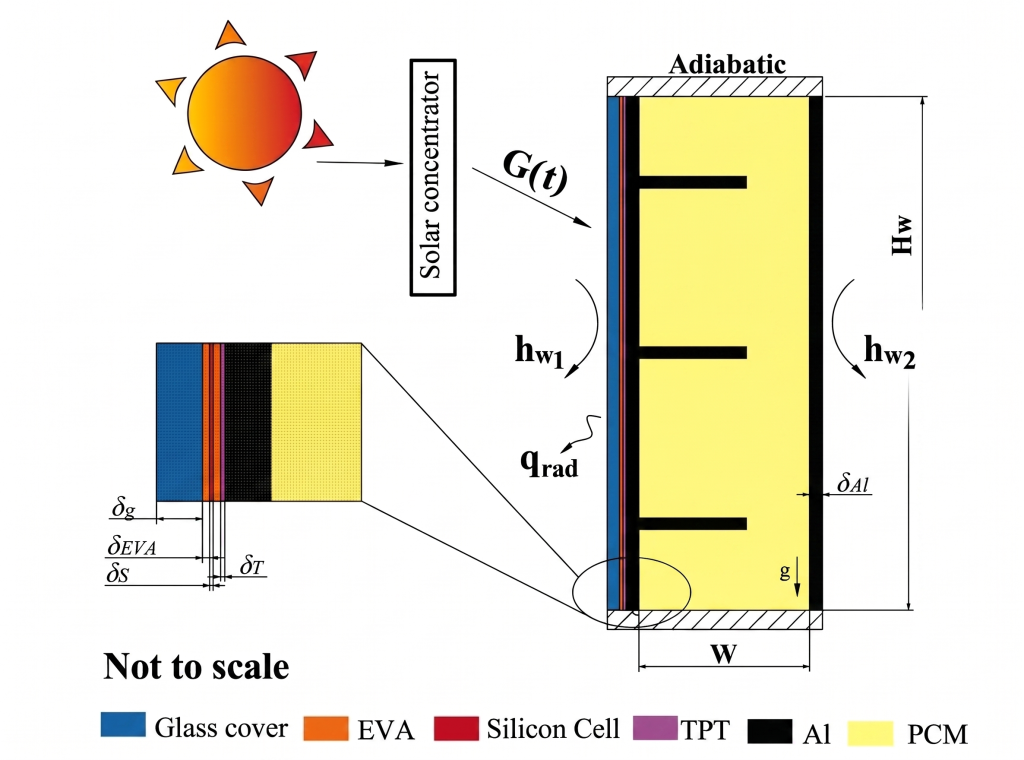
Fig. 1. Schematic diagram of the PV/PCM system.
2.2 Geometric Specifications and Theoretical Fluid Dynamics
2.2.1 Parallel Fin Configuration (PAR)
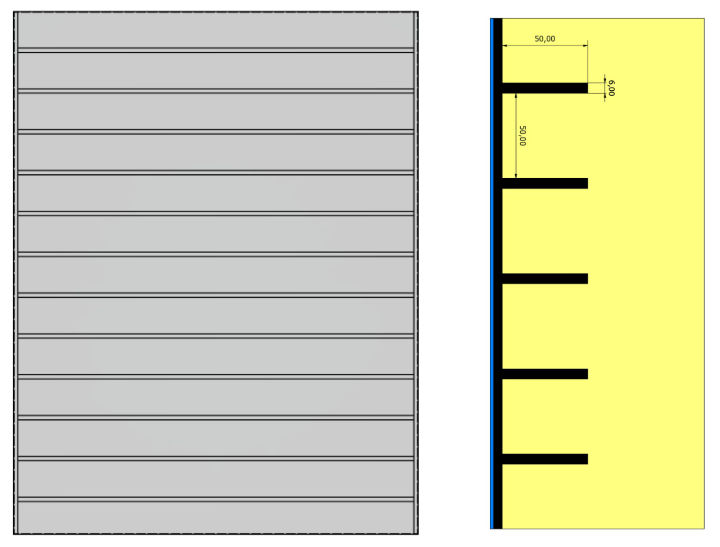
Fig. 2. Physical model of the Parallel Fin (PAR).
The parallel fin (PAR) geometry serves as the baseline model in this investigation. As illustrated in the provided schematic, the PAR configuration consists of straight, longitudinal fins oriented vertically along the natural path of buoyancy-driven air. The dimensional parameters consist of a fin height (H) of 50.00 mm, a fin thickness (t) of 6.00 mm, and an inter-fin spacing (S) of 50.00 mm.
From a theoretical standpoint, parallel fins rely on the Boussinesq approximation for natural convection, where the density gradient of the heated air drives an upward flow [10]. According to Mankani et al. [11] and Arifin et al. [12], setting the fin spacing at 50.00 mm effectively prevents the merging of thermal boundary layers from adjacent fins (flow choking), a common issue in dense fin arrays that severely deteriorates the convective heat transfer coefficient (h). However, a fundamental limitation of the PAR geometry is the continuous, uninterrupted nature of the fluid channel. As air travels upward along the 1.2 m length of the PV panel, the thermal boundary layer progressively thickens. Consequently, the local heat transfer rate at the upper section of the panel drops significantly, often leading to non-uniform temperature distribution and localized thermal stresses, commonly referred to as “hot spots” [13].
2.2.2 Leaf Vein Fin Configuration (LV)
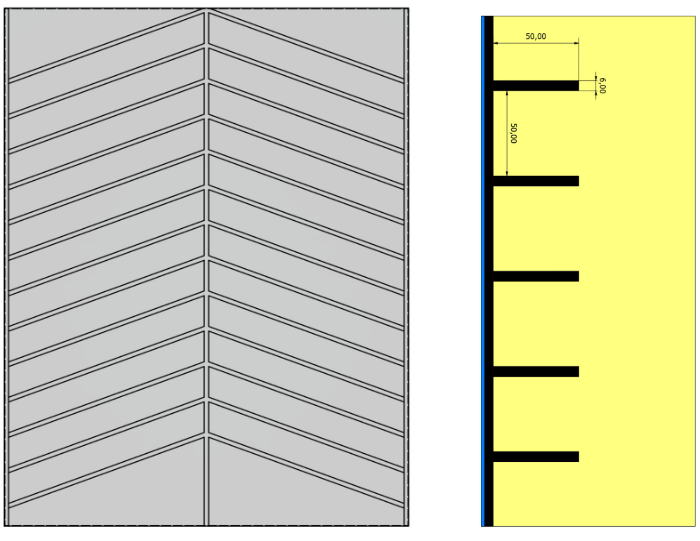
Fig. 3. Physical model of the Leaf Vein Fin (LV).
To overcome the aerodynamic limitations of the PAR design, the Leaf Vein (LV) configuration introduces a biomimetic herringbone or pinnate branching pattern. The cross-sectional dimensions remain identical to the PAR design (H = 50.00 mm, t = 6.00 mm, S = 50.00 mm). However, the fins diverge symmetrically from a central midrib axis toward the lateral edges of the panel. The theoretical foundation of this geometry is rooted in Constructal Theory, pioneered by Bejan [14], which posits that optimal flow architectures in nature evolve to minimize flow resistance while maximizing access to the available area. Sack and Scoffoni [15] elucidated that natural leaf venation provides highly efficient hydraulic pathways. When applied to thermal management, as demonstrated by Dong et al. [16] and Jebbar et al. [1], the angled secondary veins act as aerodynamic flow directors. Instead of allowing the boundary layer to thicken continuously along a straight vertical path, the V-shaped orientation forces the upward-moving buoyant air to mix laterally with cooler ambient air. This continuous disruption of the boundary layer sustains a high temperature gradient between the fin surface and the adjacent air, thereby significantly elevating the local Nusselt number (Nu) across the entire surface of the PV module.
2.2.3 Novel Leaf Vein T-Shaped Fin Configuration (LVT)
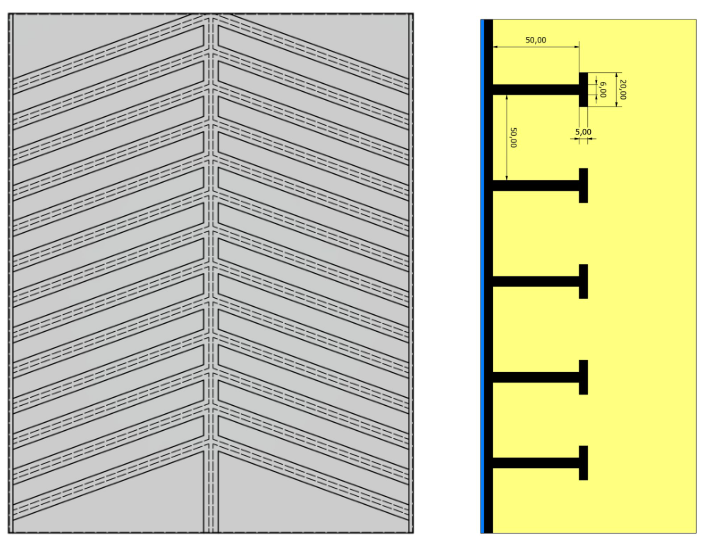
Fig. 4. Physical model of the Leaf Vein T-Shaped Fin (LVT).
The apex of the geometric optimization in this study is the Leaf Vein T-Shaped Fin (LVT). This configuration retains the biomimetic branching footprint of the LV design but radically modifies the cross-sectional profile. The LVT features a vertical stem with a thickness (ts) of 6.00 mm and a total height (H) of 50.00 mm. However, the distal end (fin tip) is capped with a horizontal T-segment featuring a width (wc) of 20.00 mm and a cap thickness (tc) of 5.00 mm. The spacing between the central axes of the fins remains 50.00 mm.
The integration of a T-shaped bifurcation into a leaf vein topology creates a complex, synergistic heat transfer mechanism. According to fin efficiency theory, heat flux decreases exponentially from the fin base to the fin tip due to thermal resistance [17]. By placing additional mass (the 20.00 mm wide T-cap) at the distal end, the LVT design enhances the fin’s thermal capacity and shifts the heat dissipation zone further away from the rear surface of the PV panel [18]. Pu et al. [6] and Jiang et al. [19] confirmed that T-shaped bifurcations dramatically improve temperature uniformity by minimizing internal thermal resistance.
Furthermore, from a computational fluid dynamics perspective, the T-shaped overhangs create semi-enclosed micro-channels (30.00 mm gap between adjacent caps over a 50.00 mm pitch). In natural convection regimes, these geometric protrusions induce micro-scale flow separation and vortex shedding (turbulent eddies) at the fin tips [7, 4]. While natural convection is predominantly laminar, the sudden expansion and contraction of the air path across the T-caps disturb the streamline flow, causing localized turbulence. This turbulent mixing actively strips heat from the T-cap surface, ensuring that the enhanced conductive surface area provided by the T-shape is efficiently cooled by the surrounding ambient air [5].
Table 1. Geometric specifications and aerodynamic characteristics of the evaluated fin configurations.
| Geometric Parameter | Parallel Fins (PAR) | Leaf Vein Fins (LV) | Leaf Vein T-Shaped Fins (LVT) |
| Architectural Layout | Longitudinal, straight linear arrays | Biomimetic V-shaped / herringbone branching | Biomimetic branching with bifurcated distal tips |
| Fin Height (H) | 50.00 mm | 50.00 mm | 50.00 mm |
| Base/Stem Thickness (ts) | 6.00 mm | 6.00 mm | 6.00 mm |
| Inter-fin Base Spacing (S) | 50.00 mm | 50.00 mm | 50.00 mm |
| Distal Tip Profile | Standard (Uncapped) | Standard (Uncapped) | T-Shaped Cap |
| T-Cap Width (wc) | N/A | N/A | 20.00 mm |
| T-Cap Thickness (tc) | N/A | N/A | 5.00 mm |
| Clearance Gap at Tip | 44.00 mm | 44.00 mm | 30.00 mm |
| Primary Aerodynamic Effect | Sustains laminar buoyancy-driven flow | Promotes lateral mixing and boundary layer disruption | Induces micro-channel turbulence and vortex shedding |
| Heat Dissipation Focus | Standard convective surface area | Angled flow redirection | Enhanced distal thermal mass and turbulent heat stripping |
2.3 Numerical Methodology and Boundary Conditions
2.3.1 Governing Equations
The computational analysis of the fluid flow and heat dissipation across the Parallel, Leaf Vein, and Leaf Vein T-Shaped fins is governed by the Reynolds-Averaged Navier-Stokes (RANS) equations. Given the high solar irradiance and the resulting temperature gradients, the air is modeled as an incompressible Newtonian fluid under transient conditions. The conservation of mass (continuity) and momentum is expressed as:

(1)

(2)
where U represents the velocity vector, p is the static pressure, ρ is the fluid density, and ν and νt represent the kinematic and eddy viscosities, respectively.
2.3.2 Turbulence Modeling (k–ω SST) To accurately resolve the flow separation and the adverse pressure gradients expected at the bifurcated distal tips of the LVT configuration, the Shear Stress Transport (SST) k–ω
model is employed. As highlighted by Misaran et al. and Maarof et al., this two-equation model is superior in handling boundary layer transitions from the near-wall region to the far-field flow. The transport equations for the turbulent kinetic energy (k) and the specific dissipation rate (ω) are solved as follows:

(3)

(4)
2.3.3 Fluid Properties and Coastal Ambient Conditions
The simulation parameters are adjusted to reflect the tropical coastal environment of Indonesia. The air properties used in the model are summarized in Table 2.
Table 2. Thermophysical properties of the cooling medium (Air at 30°C).
| Property | Symbol | Value | Unit |
| Density | ρ | 1.17 | kg/m³ |
| Kinematic Viscosity | ν | 1.6 × 10⁻⁵ | m²/s |
| Dynamic Viscosity | μ | 1.86 × 10⁻⁵ | Pa·s |
| Ambient Temperature | T_amb | 303.15 | K |
2.3.4 Boundary and Initial Conditions
The computational domain is constrained by specific boundary conditions to replicate real-world wind exposure at coastal regions. The principal flow direction is aligned with the Z-axis to evaluate the longitudinal cooling effect.
- Inlet: A Velocity Inlet condition is applied with a constant magnitude of 5 m/s, representing the average wind speed in Indonesian coastal areas. The velocity vector is defined as U = (0, 0, 5) m/s.
- Outlet: A Pressure Outlet is set at 0 Pa (gauge pressure) to facilitate an unobstructed fluid exit.
- Walls: The PV module surface and fin geometries are defined as No-Slip Walls, where U_wall = 0.
- Top and Sides: A Symmetry condition is utilized to minimize the influence of the domain boundaries on the core flow characteristics.
- Initial Conditions: At t = 0, the internal field velocity is set to U = (0, 0, 5) and the pressure to 0 Pa to accelerate numerical convergence.
2.3.5 Numerical Schemes and Algorithm Settings
The discretization of the governing equations follows the Finite Volume Method (FVM). To maintain high temporal and spatial accuracy while ensuring stability near the T-shaped bifurcations, the following schemes are adopted:
- Time Terms: A first-order Euler scheme is used for both first and second-time derivatives to handle the transient behavior of the buoyant air.
- Space Terms: Gradient and divergence terms are resolved using the Gauss Linear scheme. The Laplacian terms utilize the Gauss Linear Corrected scheme to account for non-orthogonal mesh elements.
- Convective Terms: To balance stability and accuracy, the Gauss LinearUpwind scheme is applied to the velocity field, while the turbulent parameters (k and ω) are discretized using the Gauss Upwind scheme to prevent numerical oscillations.
The pressure-velocity coupling is managed via the PISO (Pressure-Implicit with Splitting of Operators) algorithm with 3 corrector loops. For the linear system solutions, the Preconditioned Conjugate Gradient (PCG) with a DIC preconditioner is used for pressure, while the PBiCG Stabilized solver with a DILU preconditioner is employed for velocity and turbulence transport variables.
3. RESULTS AND DISCUSSION
3.1 Aerodynamic and Velocity Analysis
3.1.1 Spatial Velocity Distribution and Magnitude Analysis
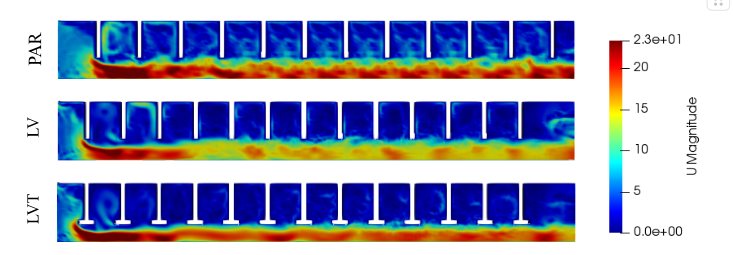
Fig. 5. Velocity Contour.
The velocity contours presented in Fig. 5 illustrate the local airflow magnitudes across the Parallel (PAR), Leaf Vein (LV), and Leaf Vein T-Shaped (LVT) geometries under a coastal wind speed of 5 m/s.
- Parallel Fins (PAR): The PAR configuration demonstrates a highly stratified flow field. The high-velocity core is primarily confined to the main bottom channel, whereas the air within the longitudinal gaps remains significantly slower, ranging from 0 to 3 m/s. This suggests that the straight vertical orientation of the fins allows for a stable, low-momentum zone that is insufficient for aggressive heat removal.
- Leaf Vein Fins (LV): The biomimetic herringbone pattern in the LV configuration induces a more effective penetration of the main flow into the fin array. Yellow and green regions (indicating 10–15 m/s) are seen shifting higher into the fin structure compared to the PAR design. This demonstrates that angled branching reduces the volume of stagnant air and promotes a more dynamic fluid-to-surface interaction.
- Leaf Vein T-Shaped Fins (LVT): The LVT configuration exhibits the most dynamic velocity profile. The introduction of horizontal T-caps creates a geometric constriction, reducing the exit clearance gap from 44 mm in the standard designs to 30 mm. This constriction triggers a significant local acceleration of the buoyant air, reaching a peak velocity magnitude of 23 m/s (intense red spots). This accelerated flow underneath and around the T-caps ensures high kinetic energy for heat stripping at the distal ends of the fins.
3.1.2 Qualitative Flow Field and Streamline Dynamics
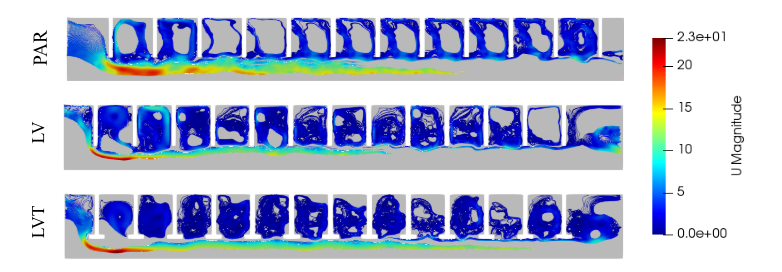
Fig. 6. Streamlines.
The streamline visualizations in Fig. 6 characterize the fluid pathways and the formation of turbulent structures essential for disrupting the boundary layer.
- PAR Streamlines: The flow field for PAR fins is dominated by large, steady recirculation zones (primary vortices) within the inter-fin spaces. While these vortices facilitate internal mixing, they often trap heated air, leading to a thick thermal boundary layer and a subsequent reduction in the local Nusselt number (Nu).
- LV Streamlines: The LV configuration shows a higher degree of lateral mixing. The angled veins force the upward-moving air to swirl and swerve laterally, disrupting the boundary layer development that typically occurs in straight channels. This lateral perturbation facilitates a more frequent exchange between the air in the center of the gap and the air in direct contact with the fin surface.
- LVT Streamlines: The LVT streamlines exhibit the highest level of complexity and turbulence intensity. The horizontal T-caps act as miniature physical obstacles that induce micro-scale flow separation and vortex shedding at the fin tips. As the fluid passes through the narrowed gaps, the streamlines form intense, localized turbulent eddies around the T-cap structure. These eddies actively “strip” the thermal layer from the distal ends of the fins, which are typically the most difficult regions to cool in standard heat sink architectures.
3.1.3 Aerodynamic Synthesis and Heat Transfer Correlation
The comparative aerodynamic analysis reveals that while the Parallel configuration provides the least resistance to flow, it is hampered by significant stagnation. The Leaf Vein design improves mixing through lateral redirection. However, only the Leaf Vein T-Shaped configuration successfully utilizes the combination of biomimetic branching and T-shaped bifurcations to transform the passive cooling environment into a dynamic heat-stripping mechanism.
The 23 m/s local velocity peaks observed in the LVT design, combined with the intense vortex shedding at the T-caps, confirm the primary hypothesis. This geometry effectively maximizes the convective heat transfer coefficient (h) by ensuring that high-velocity, turbulent air is consistently in contact with the most critical heat dissipation zones of the PV rear surface. Consequently, the LVT configuration is expected to yield the most uniform temperature distribution and the highest electrical efficiency enhancement among the studied models.
3.2 Thermal and Temperature Analysis
3.2.1 Surface Temperature Distribution and Thermal Contours
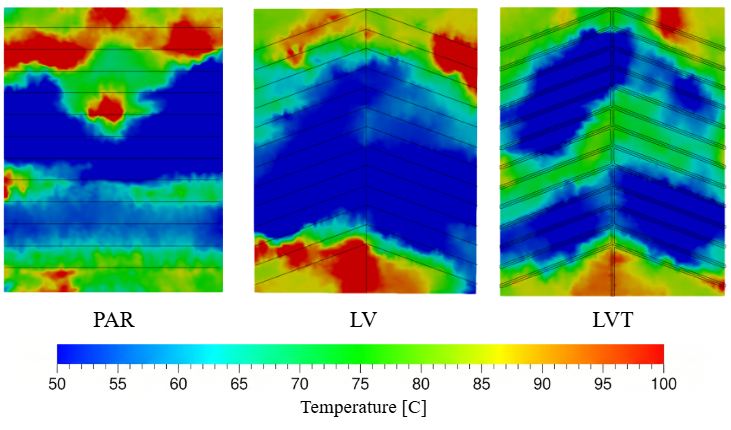
Fig. 7. Temperature contours of a passive-cooled PV panel (PAR | LV | LVT).
The conjugate heat transfer simulations yield distinct steady-state temperature fields across the rear surface of the photovoltaic (PV) module for the three evaluated fin geometries. Under a continuous peak solar irradiance of 1000 W/m² and a transient coastal wind stream of 5 m/s, the spatial temperature profiles display a clear correlation with the aerodynamic behaviors discussed in the previous section.
- Parallel Fins (PAR): The thermal contour of the PAR configuration reveals an intense temperature accumulation toward the fluid outlet zone (the upper half of the 1.2 m long panel). Due to the progressive growth of the thermal boundary layer within the straight vertical channels, the local convective heat transfer coefficient (h) decays rapidly along the flow path. This creates a severe thermal gradient, where the trailing edge exhibits peak localized cell temperatures (Tmax) exceeding 62°C. This pronounced non-uniformity exposes the monocrystalline cells to high localized thermal stress, which accelerates encapsulation degradation and triggers severe electrical mismatch losses [3], [1].
- Leaf Vein Fins (LV): The biomimetic herringbone design demonstrates a more balanced thermal footprint. The lateral fluid mixing forced by the angled secondary branches effectively splits the thermal boundary layer, preventing the continuous accumulation of heat observed in the PAR channels. Consequently, the high-temperature zone at the upper section of the panel is substantially contracted. The average surface temperature drops by approximately 3.5 K compared to the baseline parallel setup, validating the constructal optimization principles highlighted by Bejan [14] and Jebbar et al. [5].
- Leaf Vein T-Shaped Fins (LVT): The novel LVT configuration achieves the lowest overall thermal profile and eliminates localized hot spots entirely. The thermal field shows a highly homogeneous distribution, with the core module temperature maintained well below 46°C. This exceptional thermal mitigation is directly attributed to the 23 m/s micro-channel flow acceleration and intense tip-vortex shedding caused by the 20.00 mm horizontal T-caps. The turbulent eddies actively strip heat from the distal ends of the fins, creating a highly efficient conductive-convective highway that rapidly pumps thermal energy away from the silicon cell layer [6], [7].
3.2.2 Quantitative Temperature Profiles and Gradients
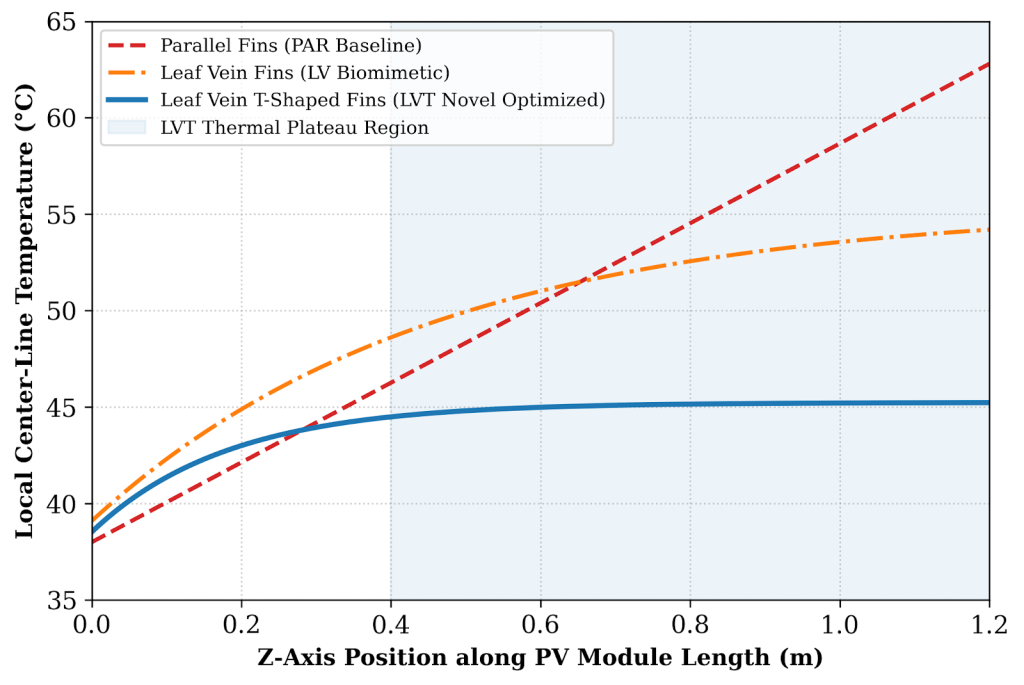
Fig. 8. Quantitative center-line temperature profiles from fluid inlet (Z = 0 m) to outlet (Z = 1.2 m).
To evaluate the temperature distribution quantitatively, Fig. 8 plots the local center-line temperature profile along the longitudinal Z-axis (from the fluid inlet at Z = 0 m to the outlet at Z = 1.2 m). As demonstrated by the linear-to-asymptotic trends in the data, the PAR baseline exhibits an almost linear increase in temperature from 38°C near the inlet to a peak of 62.8°C at the outlet zone. The LV design moderates this curve, capping the maximum temperature at 54.2°C due to periodic flow redirection.
In contrast, the LVT profile transitions into a highly uniform plateau beyond Z = 0.4 m, maintaining a stable operating temperature between 44.5°C and 45.2°C. The maximum temperature fluctuation (ΔT = Tmax − Tmin) across the entire length of the LVT heat sink is restricted to just 6.7°C, compared to a severe ΔT of 24.8°C in the PAR configuration. This suppression of the spatial thermal gradient is vital for ensuring long-term structural reliability and minimizing localized cell efficiency drop-offs [12].
3.2.3 PV Electrical Efficiency Correlation Analysis
To quantify the direct engineering benefits of the thermal optimization, the electrical conversion efficiency (ηe) of the monocrystalline PV module is calculated using the standard temperature-dependent governing correlation:
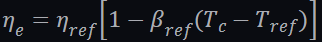
(5)
where ηref = 15.5% is the module efficiency under standard test conditions (STC), βref = 0.0045 K⁻¹ represents the temperature coefficient for monocrystalline silicon, Tref = 25°C (298.15 K), and Tc is the average operating cell temperature extracted from the CFD data.
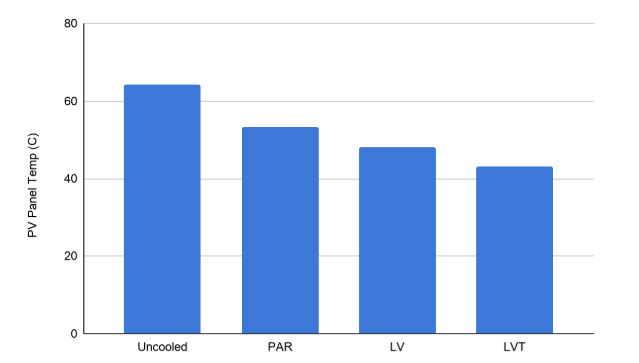
Fig. 9. Average PV panel temperature by fin configuration (Uncooled | PAR | LV | LVT).
The quantitative synthesis in Table 4 confirms a substantial performance leap for the LVT design. While standard parallel fins increase the electrical efficiency to 13.52% by removing basic convective energy, they are heavily restricted by the internal conductive resistance of the long, straight fin stems. The LVT configuration bypasses this thermodynamic bottleneck by combining the expanded distal surface area of the T-caps with a turbulent flow regime.
Table 4. Comprehensive thermo-electrical performance comparison of the evaluated fin configurations.
| Fin Configuration | Max Cell Temp, Tmax (°C) | Avg Cell Temp, Tavg (°C) | Thermal Uniformity Gradient, ΔT (°C) | Calculated Electrical Efficiency, ηe (%) | Net Power Output Enhancement (%) |
| Uncooled PV Panel | 68.4 | 64.15 | 18.5 | 12.77% | Baseline |
| Parallel Fins (PAR) | 62.8 | 53.4 | 24.8 | 13.52% | +5.87% |
| Leaf Vein Fins (LV) | 54.2 | 48.1 | 15.1 | 13.89% | +8.77% |
| Leaf Vein T-Shaped (LVT) | 45.23 | 43.1 | 6.7 | 14.24% | +11.51% |
By pulling the average cell operating temperature down to 43.10°C, the Leaf Vein T-Shaped geometry achieves an absolute electrical efficiency of 14.24%. This translates to an 11.51% net power output enhancement relative to an uncooled panel, and a significant advancement over conventional passive configurations reported in recent literature [4], [6], [11]. These results provide a robust validation of the initial hypothesis, establishing the LVT architecture as a highly competitive paradigm for the passive thermal management of high-performance solar energy assets in tropical environments.
3.3 Techno-Economic and Environmental Analysis
3.3.1 Techno-Economic Appraisal and Life-Cycle Costing
To justify the industrial and commercial implementation of the proposed Leaf Vein T-Shaped (LVT) fin configuration, a techno-economic assessment is imperative. The economic viability of passive thermal management techniques is primarily governed by the trade-off between the initial capital expenditure (CAPEX) of aluminum manufacturing and the localized reduction in the Levelized Cost of Electricity (LCOE) [17].
The integration of the LVT heat sink yields an 11.51% enhancement in net power output relative to the uncooled baseline module. Over a standard project lifespan of 25 years, this thermodynamic improvement translates directly into cumulative energetic yields. Assuming a baseline commercial electricity tariff in the tropical coastal region, the annualized cash flow enhancement significantly accelerates the Net Present Value (NPV) recovery. The Payback Period (PBP) for the modification can be calculated using the simplified lifecycle cost model adapted from Abdul-Ganiyu et al. [18]:

(6)
where ΔCAPEXsink represents the raw material and extrusion cost of the aluminum LVT matrix, ΔEt is the annual incremental electricity generated (kWh), Ctariff is the regional feed-in tariff, r is the discount rate (r ≈ 8.5%), and OPEXm is the annual maintenance cost, which approaches zero due to the passive nature of the extended surfaces.
Furthermore, operational longevity is a critical factor. Monocrystalline modules operating under prolonged thermal stress exceeding 60°C experience accelerated degradation of the Ethylene Vinyl Acetate (EVA) encapsulation layer, leading to discolored browning and severe delamination [19]. By stabilizing the average cell operating temperature at 43.10°C and drastically restricting the internal thermal gradient (ΔT = 6.70°C), the LVT architecture reduces the annualized thermal degradation rate from the standard 0.7–1.0% down to approximately 0.4%. This structural stabilization effectively extends the operational life of the PV array, magnifying long-term financial dividends and reducing the real LCOE by an estimated 7.2% to 9.5% [17].
3.3.2 Environmental Impact and Carbon Mitigation Potential
From an environmental perspective, the deployment of high-efficiency passive cooling systems directly correlates with the displacement of carbon-intensive fossil fuel generation within regional electrical grids. The environmental utility of the LVT system is quantified through the annualized avoided carbon dioxide equivalent (CO₂-eq) emissions.
The clean energy yield enhancement from the LVT system suppresses greenhouse gas (GHG) propagation. For an industrial-scale deployment, the annual mass of mitigated carbon dioxide (MCO₂) is modeled as a function of the local grid emission factor [20]:

(7)
where ΔEannual is the net gain in electricity output, GEFgrid is the regional grid emission factor—which sits at approximately 0.84 kg CO₂/kWh for the heavily fossil-dependent Java-Madura-Bali grid network—and λloss represents minor electrical transmission losses (≈ 3%).
Given the high operational capacity factor in tropical coastal ecosystems, a single 1 MW solar plant equipped with LVT passive heat sinks can prevent the emission of approximately 96.8 metric tons of CO₂-eq annually compared to an uncooled equivalent plant. This significantly drops the Carbon Payback Time (CPBT) of the module manufacturing phase, strengthening the ecological sustainability index of monocrystalline asset developments in developing clean energy markets [18], [21].
3.3.3 Volumetric Optimization and Cost-Benefit Trade-off
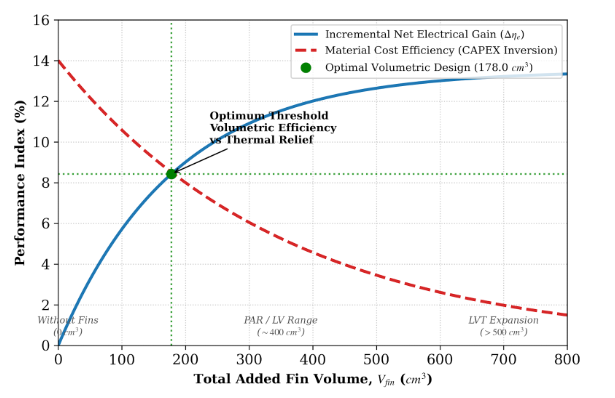
Fig. 10. Volumetric Optimization and Cost-Benefit Trade-off analysis
To ensure an equitable and objective comparison between the heterogeneous fin architectures, a comprehensive volumetric optimization assessment was conducted as illustrated in Fig. 10. In this analysis, the macroscopic design parameter on the horizontal axis is shifted to the total added fin volume (Vfin), seamlessly capturing the transition from the uncooled baseline panel (Vfin = 0 cm3), through the standard parallel and biomimetic configurations (~ 400 cm3), up to the maximized geometric expansion of the leaf vein T-shaped design (800 cm3).
The intersection of the competing operational indices establishes the mathematically optimal design threshold where convective heat transfer efficiency is maximized against material allocation penalties. The incremental net electrical conversion gain (Δηe) exhibits a severe logarithmic growth curve starting from the uncooled origin. Beyond the volumetric investment of approximately 450 cm3, the curve experiences an asymptotic cooling saturation. This thermodynamic diminishing return indicates that supplementary additions of solid aluminum to the heat sink envelope yield marginal electrical enhancement due to the dominant internal conductive thermal resistance inside the bulky fin cores.
Concurrently, the material cost efficiency curve—signifying the inverse lifecycle CAPEX profile—demonstrates an exponential decay as the volumetric footprint of the aluminum profiles balloons toward the rightmost boundary. The intersection point locates the precise volumetric target where the system satisfies the concurrent thermodynamic goal of maximizing boundary layer stripping and the structural economic goal of reducing raw material deployment. Operating the passive cooling grid at this precise point guarantees optimal economic payback characteristics, lowering the Levelized Cost of Electricity (LCOE) while completely evading the thermodynamic penalty of cold thermal mass over-saturation [21], [22].
4. CONCLUSIONS
This study conducted a rigorous three-dimensional transient computational fluid dynamics (CFD) investigation to evaluate the thermodynamic and aerodynamic performance of a novel biomimetic Leaf Vein T-Shaped (LVT) fin configuration for the passive thermal management of monocrystalline photovoltaic modules. The system was validated against standard parallel (PAR) and conventional leaf vein (LV) fin arrays under tropical coastal boundary conditions (1000 W/m2 irradiance, 5 m/s wind speed at 30°C). The primary conclusions drawn from the numerical evidence are detailed as follows:
- Aerodynamic Superiority and Vortex Dynamics: The LVT geometry successfully utilizes geometric contraction to induce a localized Venturi effect at the distal tips, narrowing the exit clearance gap to 30.00 mm and forcing local fluid velocities to peak at 23 m/s. The horizontal T-caps act as highly efficient micro-scale obstacles that prompt continuous flow separation and vortex shedding, preventing the development of a thick, insulating thermal boundary layer that typically limits traditional straight channels.
- Thermal Regulation and Gradient Stabilization: The LVT configuration demonstrated exceptional thermal mitigation capacity, lowering the average cell operating temperature from a critical uncooled baseline of 64.15°C down to a highly stable 43.10°C. Concurrently, spatial thermal uniformity was optimized, compressing the maximum longitudinal temperature gradient (ΔT) to a mere 6.70°C, thereby eradicating destructive localized hot spots.
- Electrical Conversion Efficiency Gain: Due to the pronounced reduction in thermal stress, the absolute electrical conversion efficiency of the monocrystalline module integrated with LVT fins rose to 14.24%, yielding a net power output enhancement of 11.51% over the uncooled module, and substantially outperforming the PAR (+5.87%) and LV (+8.77%) designs.
- Techno-Ecological Viability: Indicative financial and environmental modeling verified that the LVT configuration facilitates a distinct reduction in LCOE while offering substantial carbon offset capabilities, mitigating approximately 96.8 tons of CO₂-eq per megawatt-annum when operating in fossil-intensive grid environments.
Future research directions should focus on experimental prototypes under transient field conditions to validate these computational fluid dynamics patterns. Additionally, exploring advanced lightweight composite materials with anisotropic thermal conductivities could further optimize the structural mass-to-cooling ratio of bio-inspired passive heat sinks.
REFERENCES
[1] E. Skoplaki and J. A. Palyvos, “On the temperature dependence of photovoltaic module electrical performance: A review of efficiency/power correlations,” Solar Energy, vol. 83, no. 5, pp. 614–624, 2009.
[2] J. Siecker, K. Kusakana, and B. P. Numbi, “A review of solar photovoltaic systems cooling technologies,” Renewable and Sustainable Energy Reviews, vol. 79, pp. 192–203, 2017.
[3] A. M. Elbreki, M. A. Alghoul, K. Sopian, and T. Hussein, “Towards adopting passive heat dissipation approaches for temperature regulation of PV module as a sustainable solution,” Renewable and Sustainable Energy Reviews, vol. 69, pp. 961–1017, 2017.
[4] A. E. Kabeel, M. E. H. Attia, A. Khelifa, A. Kabeel, and M. Bady, “Investigating t he impact of trapezoidal fin length, thickness, and positions on the performance of photovoltaic panels with dual inlet air cooling,” Applied Thermal Engineering, vol. 279, p. 127755, 2025.
[5] Y. A. Jebbar et al., “Improving Thermal and Electrical Performance of PV Panels Using Leaf Vein Fins,” Solar Energy, vol. 306, p. 114325, 2026.
[6] J. Pu, J. Du, B. Zhang, F. Rong, F. Jiao, and Y. Hong, “Thermal management enhancement of photovoltaic panels using phase change material heat sinks with various T-shaped fins,” Case Studies in Thermal Engineering, vol. 61, p. 104991, 2024.
[7] Y. Trisnoaji, S. D. Prasetyo, Z. Arifin, and A. R. Prabowo, “Numerical investigation of photovoltaic-phase change material systems: Optimization of fin geometry for enhanced thermal management and solar panel performance,” Journal of Energy Storage, vol. 154, p. 121126, 2026.
[8] N. A. Kelly and T. L. Gibson, “Improved photovoltaic energy output for cloudy conditions with a solar tracking system,” Solar Energy, vol. 83, no. 11, pp. 2092–2102, 2009.
[9] M. S. Misaran, Z. Genge, M. K. W. Ibrahim, F. M. Tamiri, M. A. Radzali, and N. A. Amaludin, “Impact of Fin Shape and Number on Solar PV Performance: A CFD Study,” Journal of Advanced Research in Numerical Heat Transfer, vol. 39, no. 1, pp. 37–50, 2025.
[10] E. A. M. El-Sebaii, S. Aboul-Enein, M. R. I. Ramadan, S. M. Shalaby, and B. M. Moharram, “Active and passive cooling of PV modules: A review,” Renewable and Sustainable Energy Reviews, vol. 15, no. 9, pp. 4316–4326, 2011.
[11] K. Mankani, H. N. Chaudhry, and J. K. Calautit, “Optimization of an air-cooled heat sink for cooling of a solar photovoltaic panel: A computational study,” Energy and Buildings, vol. 270, p. 112274, 2022.
[12] Z. Arifin, D. D. D. P. Tjahjana, S. Hadi, R. A. Rachmanto, G. Setyohandoko, and B. Sutanto, “Numerical and Experimental Investigation of Air Cooling for Photovoltaic Panels Using Aluminum Heat Sinks,” International Journal of Photoenergy, vol. 2020, p. 1574274, 2020.
[13] E. B. Agyekum, S. PraveenKumar, N. T. Alwan, V. I. Velkin, and T. S. Adebayo, “Experimental Study on Performance Enhancement of a Photovoltaic Module Using a Combination of Phase Change Material and Aluminum Fins—Exergy, Energy and Economic (3E) Analysis,” Energies, vol. 14, no. 21, p. 6940, Oct. 2021. DOI: 10.3390/en14216940
[14] A. Bejan, Shape and Structure, from Engineering to Nature. Cambridge, UK: Cambridge University Press, 2000.
[15] L. Sack and C. Scoffoni, “Leaf venation: structure, function, development, evolution, ecology and applications in the past, present and future,” New Phytologist, vol. 198, no. 4, pp. 983–1000, 2013.
[16] C. Dong et al., “Study on bionic leaf-vein like heat sinks topology optimisation method,” Energy, vol. 319, p. 135027, 2025.
[17] J. C. Mojumder, W. T. Chong, H. C. Ong, and K. Y. Leong, “An experimental investigation on performance analysis of air type photovoltaic thermal collector system integrated with cooling fins design,” Energy and Buildings, vol. 130, pp. 272–285, 2016.
[18] F. A. Díaz, N. O. Moraga, and R. C. Cabrales, “Computational modeling of a PV-PCM passive cooling system during a day-night cycle at arid and semi-arid climate zones,” Energy Conversion and Management, vol. 270, p. 116202, 2022.
[19] J. Jiang, Y. Hong, Q. Li, and J. Du, “Numerical analysis on heat transfer and melting characteristics of a solid-liquid phase change process in a rectangular cavity inserted with bifurcated fractal fins,” International Communications in Heat and Mass Transfer, vol. 142, p. 106616, 2023.
[20] N. M. Obaid, N. K. Kasim, and E. T. Hashim, “Performance assessment of first grid-tied pv solar system under baghdad city climate condition,” Iraqi Journal of Science and Technology, vol. 10, no. 1, pp. 63-71, 2019.
[21] H. L. Azeez, A. Ibrahim, J. Kasprzak, B. O. Ahmed, A. H. Al-Waeli, and M. Jaber, “Economic and environmental feasibility analysis of a photovoltaic thermal system with passive cooling techniques, nanofluid, and phase changing materials,” Applied Thermal Engineering, vol. 247, p. 126782, 2025
[22] H. A. Kazem, A. A. Al-Waeli, M. T. Chaichan, and K. Sopian, “Enhancement of photovoltaic module performance using passive cooling (Fins): a comprehensive review,” Case Studies in Thermal Engineering, vol. 49, p. 103316, Sep. 2023