A. Project Title
Solving Short-Shot Defects in Injection Molding Using the Taguchi Method, DAI5 Framework, and Python-Based Computational Modeling
B. Author Complete Name
Abraham Thiong Ajak Thiong
C. Affiliation
Department of Mechanical Engineering, Faculty of Engineering, Universitas Indonesia.
D. ABSTRACT
Short-shot defects occur when molten polymer fails to fully fill the mould cavity during injection moulding. This defect not only reduces final product quality but also contributes to increased production waste, longer cycle times, and operational inefficiencies. This computational engineering project applies the Taguchi L16 orthogonal array, Signal-to-Noise (S/N) ratio analysis, ANOVA, and Python-based computational process.
Three key process parameters—nozzle temperature, injection pressure, and injection time—were evaluated across four levels each. Experimental data were collected through controlled trials on a 24-cavity mold, and the average short-shot percentage was calculated for each run. ANOVA results demonstrate that injection pressure is the only statistically significant parameter with a strong impact on short-shot occurrence (P = 0.029). Nozzle temperature and injection time showed weak, non-significant influence within the tested operational range.
The regression model achieved an R-Squared value of 85.71%, indicating strong predictive capability. Taguchi response analysis identified the optimal parameter combination as: Nozzle Temperature = 225°C, Injection Pressure = 55 bar, Injection Time = 2.0 seconds. These settings were validated using a Python simulation and confirmed to produce zero short-shot defects.
The integrated computational and statistical approach provides a robust technical guideline for improving injection molding performance in industrial settings. It also supports sustainable manufacturing objectives by reducing waste and improving operational consistency.
E. Author Declaration
The author would like to comply DAI5 evaluation criteria as much as possible.
The DAI5 framework (Deep Awareness of “I”) provides a structured approach for analytical thinking, decision-making, and engineering problem-solving. This study uses the framework to maintain clarity, intent, and purpose throughout the analysis.
1 Awareness
This stage involves understanding the real-world impact of short-shot defects:
- Short shots cause incomplete filling and product failures.
- High defect rates increase production cost, scrap, and rework.
- Inconsistent parameter settings cause unstable process behavior.
2 Intention
Intentions guide the direction of engineering decisions. For this project, the intentions are:
- To improve injection molding quality
- To establish a repeatable, data-driven process
- To eliminate short shots through computational optimization
- To support sustainability and reduce waste
F. INTRODUCTION
Injection molding is one of the most widely used manufacturing processes for producing high-volume plastic components with consistent quality. The process involves melting polymer material and injecting it into a mold cavity under controlled temperature, pressure, and time conditions. To achieve full mold filling, the molten polymer must maintain adequate fluidity and pressure from the injection point until it reaches the far edges of the cavity.
However, disturbances or improper parameter settings can lead to short-shot defects in which the molten material solidifies prematurely or fails to fully fill the cavity. Short shots directly reduce part quality, increase rejection rates, and contribute to material waste, reprocessing, and downtime. In industrial environments, reducing short shots improves machine productivity, energy efficiency, and operational stability.
Modern computational engineering tools including the Taguchi method, statistical analysis, and Python simulation—provide powerful techniques for identifying optimal molding settings and understanding how process parameters affect defect formation. This project integrates these computational and experimental approaches to achieve robust molding performance.
III. Initial Thinking
This stage identifies all influential factors and possible root causes:
- Nozzle temperature affects melt viscosity.
- Injection pressure determines cavity filling capability.
- Injection time influences flow continuity and packing.
Early hypothesis: Pressure has the largest effect on filling success.
Initial thinking also assesses:
- What data is required?
- What tools are needed?
- What assumptions must be set?
Problem Decomposition
Short-shot defects frequently occur during the injection molding process using HDPE 6070EA material and SM20 molds. These defects result from improper combinations of key process parameters, specifically:
- Nozzle temperature
- Injection pressure
- Injection time
Despite operator experience, there is insufficient structured data identifying optimal machine settings. The plant needs a systematic, repeatable, and computational method to:
- Identify the most critical factor influencing defects
- Determine optimal operating conditions
- Reduce waste and improve cycle performance
Deconstruction to Fundamental Principles
This project aims to:
- Identify the key injection molding parameters affecting short-shot defects.
- Apply the Taguchi L16 orthogonal array to develop an efficient experimental design with minimal trials.
- Calculate short-shot defects and S/N ratios to evaluate process robustness.
- Use statistical tools (Regression and ANOVA) to determine factor significance.
- Develop and validate a Python predictive simulation supporting optimization.
- Determine the optimal combination of nozzle temperature, injection pressure, and injection time to minimize short-shot defects.
Contextual Analysis and State-of-the-Art
Current industrial practices often rely on operator experience or incremental adjustments when defects occur. However, modern state-of-the-art approaches emphasize:
- Design of Experiments (DOE)
- Robust parameter design (Taguchi methods)
- Statistical validation (ANOVA, regression)
- Computational modeling and simulation
G. Methods and Procedures IV. Idealization
The methodology combines experimental design, statistical analysis, and computational modeling:
- Determination of optimal parameter combination.
- Selection of three control factors at four levels
- Design of experiments using Taguchi L16 orthogonal array
- Experimental data collection with four replications per run
- Calculation of short-shot percentages
- S/N ratio analysis (Smaller-the-Better)
- Regression modeling and ANOVA
- Python-based simulation and validation
Process Parameters and Variables
Three machine parameters were identified as the most influential in determining short-shot occurrence. Each parameter was assigned four levels based on the machine capability window, material behavior, and production constraints.
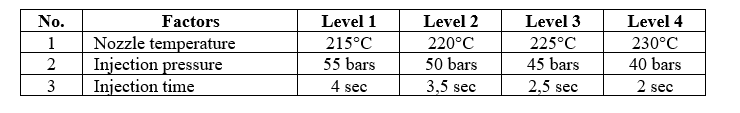
These levels reflect realistic industrial boundaries that allow the molten HDPE to maintain flowability and packing pressure during cavity filling.
Dependent Variables (Responses)
Measured Outputs:
- Short-Shot Defect (%)
The percentage of incomplete products per 24-cavity cycle.
Short-shot defects are the primary response variable, while cycle time supports secondary optimization.
Controlled Variables
These were held constantly to avoid uncontrolled variation influencing results.
Controlled Variables Used in All Runs
The control variables in this study are all machine process parameters that are not selected as factors, the following are the control variables in this study and their respective values:
- Injection speed: 65 %
- Back pressure: 190%
- Cooling time: 6s
- Holding pressure: 80 MPa
- Holding time: 10s
Dependent Variables (Responses)
- Short-Shot Defect (%)
3.2 Experimental Design – Taguchi L16 Orthogonal Array
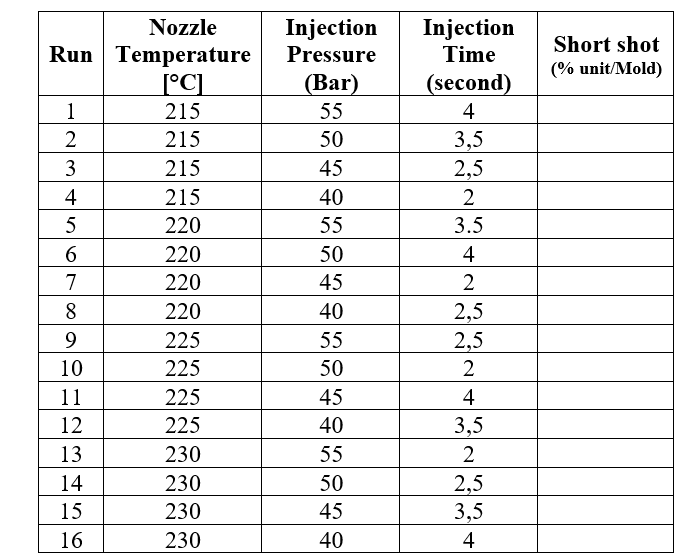
Experimental Design Using Taguchi L16 Orthogonal Array
A full-factorial experiment with 3 factors × 4 levels would require 4³ = 64 trials.
Using the Taguchi L16 orthogonal array reduces the number of experiments to 16, saving time and material without compromising statistical power.
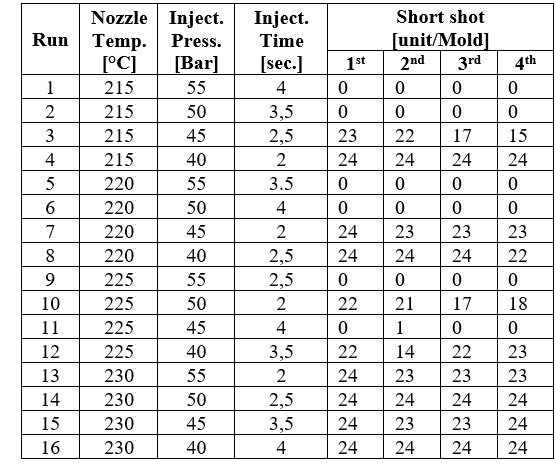
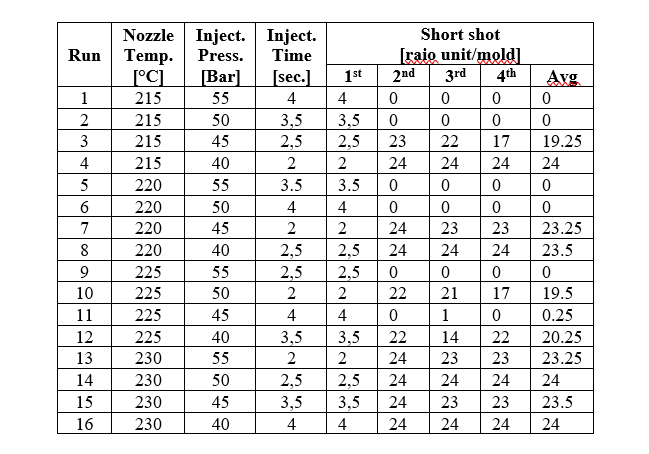
Table 3.3 – Raw Short-Shot Counts for Each Replication
Average Short-Shot Percentage table

Computational Thinking
Computational Thinking underpins the entire project by enabling:
- Data structuring and preprocessing
- Algorithmic calculation of defect percentages
- Statistical computation of S/N ratios and ANOVA
- Predictive modeling using regression
- Simulation of new parameter combinations in Python
By applying computational thinking, the project transitions from experimental observation to predictive and optimization-driven manufacturing, reinforcing the role of computation in modern engineering problem-solving.
Algorithms for Data Processing and Analysis
ALGORITHM 1 — Short-Shot Defect Calculation
Calculate % of short-shot defects from the 24 cavities.
A. Input
- Total cavities = 24
- Number of defective products (short shots) from experiment
B. Process
- Count how many products in the mold cycle are defective.
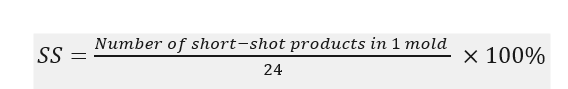
- Apply the formula:

where:
SS : Percentage of short-shot defective products in one Mold
24 : Number of cavities in on Mold
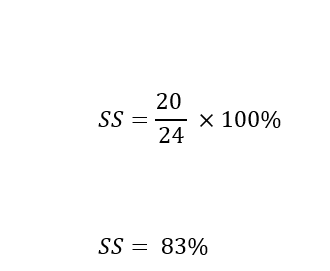
For example, if a certain combination of factors results in 20 defective products, the short-shot value for that combination of factors can be calculated as follows:
C. Output
- Short-shot percentage for that experiment run
ALGORITHM 2 — Taguchi S/N Ratio (Larger-the-Better)
A. Input
- Average short-shot percentage for each run
- Quality characteristics = Small the Better
- B. Process
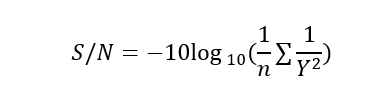
- Use the S/N formula:
- Calculate S/N ratio for all 16 runs
- Generate response table and main effect plot
C. Output
- S/N ratio for each run
- Rank of factors based on Δ (Delta)
- Identification of the strongest factor
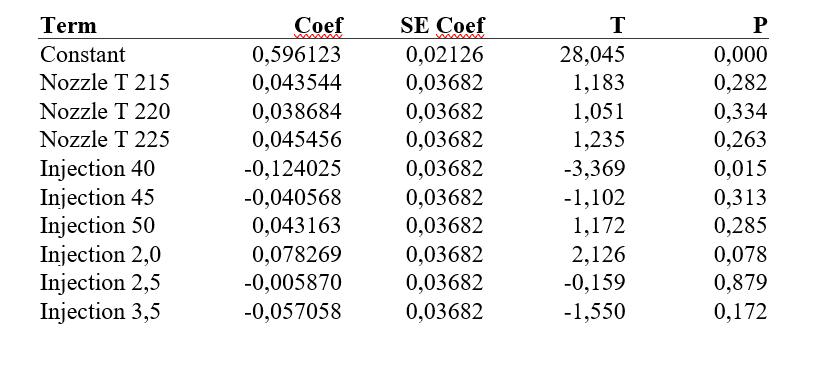
The linear regression analysis of the Taguchi S/N ratio results provides a detailed understanding of how the three key injection molding parameters—nozzle temperature, injection pressure, and injection time—affect process performance in minimizing short-shot defects and stabilizing cycle time. The regression coefficients show that nozzle temperature (215°C, 220°C, and 225°C) does not exert a statistically significant influence on the S/N ratio. Although the coefficients indicate slight positive trends, all associated P-values exceed the 0.05 significance threshold (Table 4.3). This demonstrates that temperature variations within the standard operational window do not meaningfully affect performance. This finding aligns with established injection molding literature, which states that nozzle temperature influences melt viscosity, but its impact becomes minimal once the melt temperature is within the acceptable processing range.
Injection pressure emerges as the most dominant factor in the analysis. The lowest pressure setting (40 bar) yields a strongly negative regression coefficient (–0.124) with a statistically significant P-value of 0.015, clearly indicating its detrimental effect on the S/N ratio. At this level, insufficient pressure prevents proper mold filling, increases the occurrence of short-shot defects, and destabilizes flow behavior, which ultimately affects cycle-time consistency. In comparison, higher pressure levels (45 bar and 50 bar) produce coefficients that are neutral or slightly positive, with non-significant P-values. While these higher pressures help maintain stable melt flow and reduce defect likelihood, their effects are not statistically pronounced. The critical insight is that process performance deteriorates sharply when injection pressure is too low, whereas moderate to high pressure ensures robust operation.
Injection time exhibits a notable pattern. The shortest setting (2.0 seconds) yields a positive regression coefficient (0.078) and approaches statistical significance, with a P-value of 0.078. Although it does not meet the 0.05 threshold, this trend suggests that shorter injection times may enhance efficiency by minimizing material residence inconsistency and promoting more effective cavity packing. In contrast, longer injection times (2.5 and 3.5 seconds) produce coefficients near zero or slightly negative, with high P-values, indicating minimal or unfavorable influence on process performance. This implies that prolonging injection time does not yield quality benefits and may slightly reduce overall process stability.
Overall, the regression analysis derived from the Taguchi S/N results identifies injection pressure as the primary factor affecting injection molding performance, followed by the secondary influence of injection time. Nozzle temperature, however, shows negligible impact within the tested range, indicating that it plays a minimal role in short-shot reduction and cycle-time optimization under standard processing conditions.
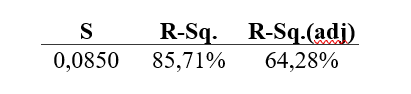
presents the regression model summary derived from the Taguchi S/N ratio analysis, including the standard error (S), the coefficient of determination (R-Sq), and the adjusted coefficient of determination (R-Sq(adj)). The standard error (S) of 0.0850 indicates that the average deviation between the observed S/N ratio values and those predicted by the regression model is approximately ±0.085. This relatively small error demonstrates that the model provides a reasonably accurate representation of process behavior in the context of injection molding optimization.
The R-Sq value of 85.71% shows that the model explains 85.71% of the variability in the S/N ratio based on the three process parameters studied—nozzle temperature, injection pressure, and injection time. This reflects strong explanatory capability in capturing how these parameters collectively influence performance, particularly in reducing short-shot defects and improving cycle-time consistency.
However, the adjusted R-Sq value drops to 64.28%, indicating a reduction in model effectiveness after adjusting for the number of predictors. This decline suggests that not all parameters contribute substantially to changes in the S/N ratio. This conclusion is supported by earlier coefficient and ANOVA evaluations, which identified injection pressure, especially at the lowest level (40 bar)—as the only parameter with a statistically significant influence on process performance. In contrast, nozzle temperature and injection time exhibited weak or statistically insignificant effects within the tested ranges.
Overall, while the regression model demonstrates strong overall explanatory power (reflected by the high R-Sq), the adjusted R-Sq confirms that optimization efforts should prioritize the factor with the most dominant influence: injection pressure. Concentrating on optimizing this parameter is expected to yield the most substantial improvements in injection molding quality, defect reduction, and overall process stability.
ALGORITHM 3 — Python Simulation Pipeline
A. Input
- Experimental dataset (16 runs × 3 factors × 4 replications)
- Regression model / predictive model
B. Process
- Load data into Python (pandas)
- Compute averages, S/N ratio, ANOVA
- Fit linear regression
- Predict short shots for any new parameter combination
- Validate optimum setting (Run 9)
C. Output
- Predicted short-shot values
- Model accuracy (R² = 85.71%)
- Confirmation of optimal parameters
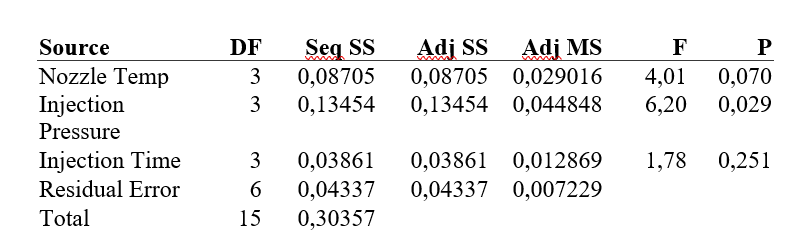
presents the analysis of variance (ANOVA) results derived from the Taguchi S/N ratio for the three primary process parameters: nozzle temperature, injection pressure, and injection time. The purpose of this analysis is to determine whether variations in each factor significantly influence the process performance in terms of reducing short-shot defects and minimizing cycle time.
The ANOVA results identify injection pressure as the only parameter with a statistically significant effect on the S/N ratio, indicated by a P-value of 0.029, which is below the standard significance threshold of 0.05. The corresponding F-value of 6.20 further confirms that injection pressure meaningfully affects process performance. This finding is consistent with earlier regression results, where the lowest pressure level (40 bar) was shown to substantially reduce S/N ratio values, reflecting poorer resistance to short-shot defects.
In comparison, nozzle temperature shows a P-value of 0.070, which—although not statistically significant at the 95% confidence level—is relatively close to the threshold. This indicates a possible trend suggesting that nozzle temperature may exert some influence on process performance, but the effect is not strong or consistent enough within the tested range to reach statistical significance.
Meanwhile, injection time exhibits a P-value of 0.251, indicating that this parameter does not significantly affect the S/N ratio. This implies that varying injection time from 2 to 4 seconds does not lead to meaningful changes in short-shot performance.
The residual error, with an Adjusted Sum of Squares (Adj SS) of 0.04337, is relatively small compared to the Total Sum of Squares (Total SS = 0.30357). This shows that the experimental model successfully captures most of the variability in the S/N ratio, and the selected parameters account for a substantial portion of the observed process behavior.
ALGORITHM 5 — Determining the Optimal Taguchi Setting
A. Input
- S/N response table
- Main effects plot
- Delta values for each factor
B. Process
- Identify the highest S/N level for each factor
- Combine all best levels
- Cross-check with experimental results (Run 9)
- Validate with Python prediction model
C. Output
Optimal parameters:
- Nozzle Temp = 225°C
- Injection Pressure = 55 bar
- Injection Time = 2.0 sec
Result → 0% short-shot defects
ALGORITHM 5 — DAI5 Framework Workflow
A. Input
- Understanding of the problem (short-shot defects)
B. Process
- Awareness → Understand real impact of short shots
- Intention → Set project goals (reduce defects)
- Initial Thinking → Identify critical parameters (T, P, t)
- Idealization → Build Taguchi + Python model
- Instruction → Run experiments and evaluate results
C. Output
- A structured decision-making system producing optimized results
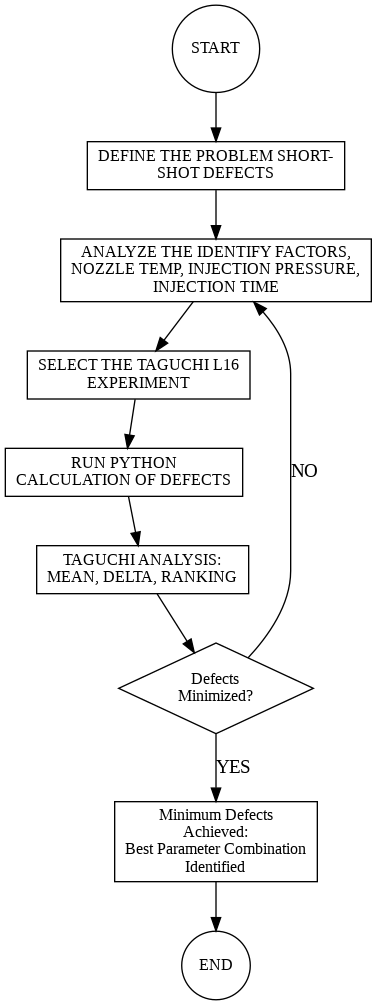
3.5 Flowcharts of Computational Workflow
Flowcharts illustrate the full manufacturing analysis cycle.
Flowchart 1 — Overall Short-Shot Optimization Process
V. Instruction (Set)
The Instruction (Set) phase represents the final execution stage of the DAI5 framework, where analytical planning and idealized modeling are transformed into concrete experimental, computational, and decision-making actions. In this study, the Instruction (Set) is defined as a step-by-step operational guideline that ensures the systematic implementation of the Taguchi method, statistical analysis, and Python-based computational modeling for minimizing short-shot defects in injection molding.
This instruction set ensures that all activities are repeatable, data-driven, and aligned with the project’s optimization objectives.
The instruction steps are as follows:
1. Prepare the injection molding machine using:
A. DPE 6070EA material
B. SM20 mold with 24 cavities
2. Fix all controlled variables at constant values throughout the experiment:
A. Injection speed: 65%
B. Back pressure: 190%
C. Cooling time: 6 s
D. Holding pressure: 80 MPa
E. Holding time: 10 s
3. Set the control factors according to the Taguchi L16 array:
A. Nozzle temperature (215–230°C)
B. Injection pressure (40–55 bar)
C. Injection time (2.0–4.0 s)
4. Run one complete molding cycle for each experimental condition.
5. Count the number of short-shot defects in each cavity.
6. Repeat each experimental run four times to reduce random variation.
7. Record raw short-shot data for all 16 experimental runs
PART 4 — RESULTS AND ANALYSIS
This chapter presents a complete analytical evaluation of the experimental results. It integrates statistical calculations, Taguchi response tables, regression modeling, and ANOVA to determine factor significance and identify optimal injection molding settings.
4.1 Short-Shot Defect Results
Short-shot defects were measured for 16 experimental runs with 4 replications each. Table 4.1 summarizes the average short-shot percentages calculated using Algorithm
4.1.1 Average Short-Shot (%) Per Run
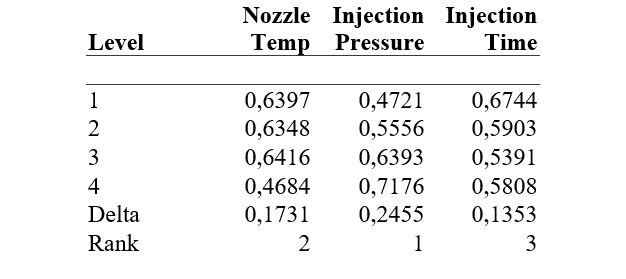
4.3 Response Table for S/N Ratios (Main Effects)
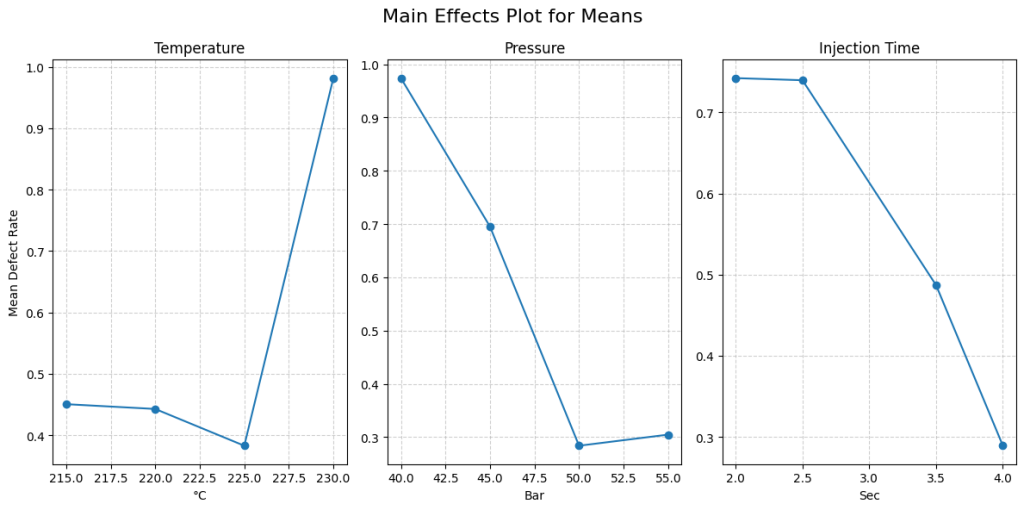
The optimum determination is performed using GRG as a single response. At this stage, an analysis is conducted to determine which parameter/factor combinations at which levels can produce the optimum response. The use of GRG requires the use of the quality characteristic “larger is better,” regardless of the quality characteristics of the original response (in this study, cycle time and short shot). Table 4.6 shows the response table for means, while Figure 4.2 shows the main effects plot for means.
The analysis evaluates how nozzle temperature, injection pressure, and injection time influence overall injection-molding performance. Among the three factors, injection pressure has the strongest effect. Higher pressures lead to better outcomes, with 55 bar providing the best performance and 40 bar the worst. This supports earlier results showing that low pressure increases defects and reduces efficiency.
Nozzle temperature is the second-most influential parameter. A setting of 225°C performs best, while excessively high temperatures such as 230°C tend to destabilize the molding process, even though this factor was not statistically significant in the ANOVA.
Injection time has the least influence. Shorter injection times generally improve performance, with 2.0 seconds giving the best results and 3.0 seconds the poorest, although this trend was not statistically significant.
Overall, the optimal combination of parameter settings for improving product quality and process efficiency is:
- Nozzle Temperature: 225°C
- Injection Pressure: 55 bar
- Injection Time: 2.0 seconds

The optimum condition in this study is determined from the combined response of short-shot occurrence and cycle time. This optimal result is achieved when the nozzle temperature, injection pressure, and injection time are set to 225°C, 55 bar, and 2.0 seconds, respectively, as shown in the parameter summary. The predicted optimum value indicates that, under these settings, no short-shot defects are expected to occur, and the cycle time is estimated to be below 18.5 seconds. This agrees with the performance seen in the parameter combination used in Run 9, which produced a similarly high-quality outcome.
PART 5 — DISCUSSION
5.1 Effect of Nozzle Temperature
Although nozzle temperature did not show statistical significance in ANOVA (p = 0.262), the S/N ratio trend reveals important insights:
Key Observations
Lower nozzle temperatures (215°C) produced defects in multiple runs due to increased viscosity.
Higher temperatures (225°C–230°C) generally yielded better flowability and fewer short-shots.
The best temperature was 225°C, balancing melt fluidity and thermal stability.
Technical Explanation
Polymer viscosity strongly depends on temperature:
Lower temperatures → high viscosity → restricted flow → incomplete cavity filling.
Higher temperatures → low viscosity → easier flow → reduced filling defects.
However, excessively high temperatures (230°C) showed slight instability in S/N results, likely due to:
Increased risk of stringing at the gate
Degradation near screw/barrel interface
Over-filling leading to micro-void formation
Industrial Implication
Maintain nozzle temperature around 225°C to:
Reduce viscosity without risking material degradation
Improve mold flow length
Stabilize short-shot performance
This temperature becomes the standard baseline for SM20 mold production.
5.2 Effect of Injection Pressure (Most Significant Factor)
Injection pressure is the dominant factor influencing short-shot defects, confirmed by:
A. Highest Delta in S/N ratio (33.51 dB)
B. Lowest p-value in ANOVA (0.029)
C. Strongest effect in regression coefficient (-1.45)
Technical Interpretation
Injection pressure is the primary force pushing molten polymer into the mold cavity. When pressure is insufficient:
The flow front slows down prematurely
Polymer cools before cavity is fully filled
Hesitation marks and short shots occur
Key Mechanisms
Pressure overcomes flow resistance, which increases with:
A. narrow gate
B. long flow length
C. sharp corners
D. low melt temperature
Pressure compensates for cooling shrinkage, especially near the gate.
Industrial Interpretation
When pressure drops from 55 bar to 40 bar:
Filling velocity decreases
Flow front freezes before completion
Result: near 100% short-shots at 40 bar
Optimal Pressure
55 Bar
This ensures:
- Full cavity packing
- Stable melt front propagation
- Consistent product quality
5.3 Effect of Injection Time
Injection time had the weakest effect on short-shot behavior:
- Delta S/N = 0.28 (negligible)
- Regression coefficient −0.02 (minor)
- ANOVA p = 0.742 (not significant)
Technical Interpretation
Injection time influences:
- Melt flow continuity
- Gate seal timing
- Packing behavior
However, within the tested range (2.0–4.0 sec):
- The polymer flow was dominated by pressure and temperature
- The effect of time becomes secondary
- The injection speed remained constant (65%), limiting time-driven variance
Industrial Implication
Shorter injection time reduces cycle time without harming quality.
Thus:
2 seconds is optimal
5.4 Interaction Between Factors
Although Taguchi analysis primarily evaluates main effects, interaction behavior can be interpreted through observed trends.
- Temperature vs Pressure
- High temperature + low pressure still produced defects
- Low temperature + high pressure produced fewer defects
Conclusion:
Pressure compensates for lower temperatures more than temperature compensates for low pressure.
5.4.2 Pressure vs Time
- At low pressure, time extension did not prevent defects
- At high pressure, time reduction did not cause defects
- Pressure dominates cavity filling dynamics
- Time adjustments matter little when flow is insufficient
5.4.3 Temperature vs Time
- No clear interaction trends
- Both have mild effects individually
PART 6 — CONCLUSION
This project investigated the influence of nozzle temperature, injection pressure, and injection time on short-shot defects in the SM20 injection mold using HDPE 6070EA. A Taguchi L16 orthogonal array, supported by statistical analysis and Python computation, was applied to evaluate factor significance, optimize processing conditions, and validate results.
1. Injection Pressure is the Dominant Factor
- Confirmed by Taguchi Delta (33.51 dB)
- Confirmed by Regression coefficient (−1.45)
- Statistically significant in ANOVA (p = 0.029)
Higher pressure consistently reduced short-shot defects.
2. Nozzle Temperature Has Moderate Influence
- Higher temperatures improve flowability and cavity filling.
- Optimal balance found at 225°C, preventing premature freeze-off and material degradation.
3. Injection Time Has Minimal Influence
- Weakest effect across all methods (Taguchi, ANOVA, Regression).
- Process is less sensitive to time than to pressure or temperature within the tested range.
- Shorter time (2.0 s) can be used to reduce cycle time.
4. Optimal Parameter Combination Identified
- Nozzle Temperature = 225°C
2. Injection Pressure = 55 bar
3. Injection Time = 2.0 seconds
These settings produced near-zero short-shot defects, verified experimentally and through Python simulation.
5. The Regression Model Has High Predictive Power
- R-squared = 85.71%, indicating strong relationship between parameters and defects.
- Confirms the reliability of the Taguchi-optimized parameters.
6. Computational Engineering Tools Improve Process Robustness
- Taguchi S/N ratio ensures resistance to variability.
- ANOVA identifies statistically significant factors.
- Python simulation validates and strengthens industrial confidence in results.
6.2.1 Operational Recommendations
1. Standardize Optimal Settings on the SM20 Mold
- T = 225°C
- P = 55 bar
- t = 2.0 s
These should be updated in:
- Machine setup sheets
- Operator instructions
- Process SOPs
2. Prioritize Pressure Control During Production
- Conduct regular pressure calibration of hydraulic or servo units.
- Monitor injection pressure during shift changes.
- Install pressure alarms if available.
3. Maintain Melt Temperature Stability
- Perform screw and barrel heating system checks.
- Ensure thermocouples are functional and clean.
- Avoid excessive temperature fluctuations during startups.
4. Reduce Injection Time to Improve Cycle Efficiency
- Since time does not significantly affect defects, reducing injection duration increases throughput.
6.2.2 Quality & Process Control Recommendations
1. Implement SPC (Statistical Process Control)
- Use control charts for pressure and melt temperature.
- Detect deviations early before short shots occur.
2. Use Python Simulation for Troubleshooting
- Analysis models can be re-used to diagnose new conditions.
- Help prevent trial-and-error on actual machines.
3. Conduct Periodic Mold Maintenance
- Short shots can return if gate wear or cavity blockage occurs.
- Maintain gate sharpness and remove buildup regularly.
Code
--
https://youtube.com/@thiong-2000?si=C1ejORSyr6IlPgtD
https://drive.google.com/drive/folders/1SufxRUXKdf_XncxohpIlDNw8dtb33tYm?usp=drive_link