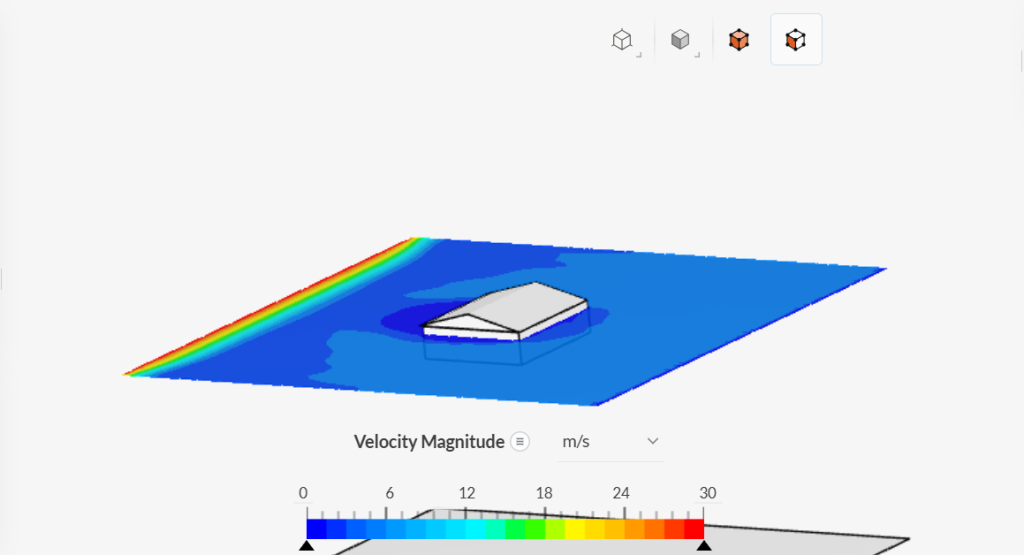
First Image (Farm House Wind Plot – Graph)
- This graph shows the variation of different moments (torques) acting on the farmhouse over time.
- The x-axis represents time (seconds), while the y-axis represents moment values (presumably in Newton-meters).
- The colored lines represent different types of moments:
- Pressure moments (x, y, z): These represent the effect of wind pressure acting on the structure.
- Viscous moments (x, y, z): These represent the effects of air viscosity on the structure.
- Total moments (x, y, z): These are the combined effects of pressure and viscosity.
- The red line (Total moment y) shows significant oscillations, suggesting strong aerodynamic forces affecting the stability of the farmhouse.
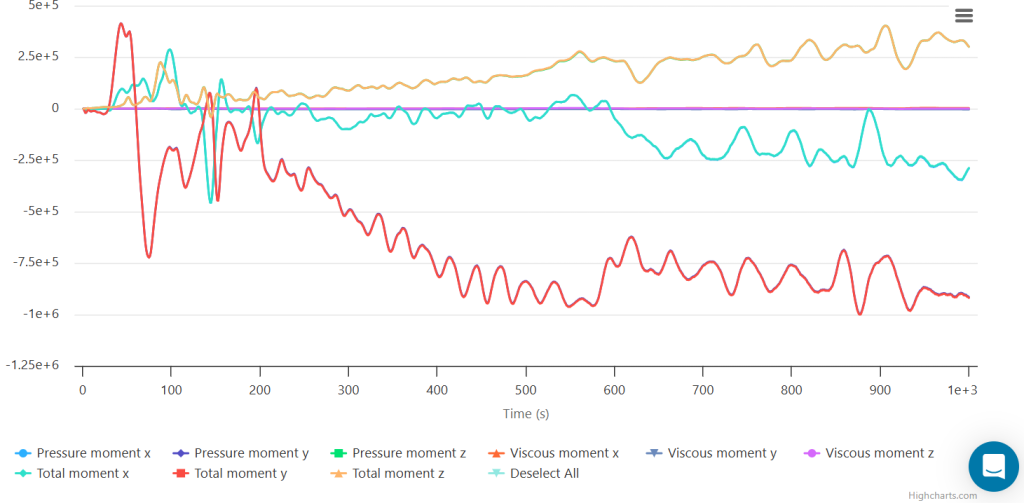
Second Image (Farm House Wind Simulation – Velocity Contour)
- This is a CFD velocity contour plot showing wind flow around the farmhouse.
- The colors represent wind velocity magnitude (m/s), with a scale at the bottom:
- Blue (low velocity): Indicates calm air regions.
- Green to Yellow (medium velocity): Moderate wind speeds.
- Red (high velocity): Strong wind impact.
- The farmhouse is placed in the middle, and we see a high-velocity wind region (red) on the windward side.
- The area behind the house has lower wind speeds (blue), suggesting wind shielding or turbulence.
- The simulation helps analyze wind resistance and identify possible structural weaknesses in strong winds.
Purpose of the Simulation
This study is likely conducted to assess:
- Wind loads on the farmhouse to ensure structural stability.
- Aerodynamic performance, including pressure distribution and possible vortex shedding.
- Optimization of the farmhouse design to withstand strong winds.