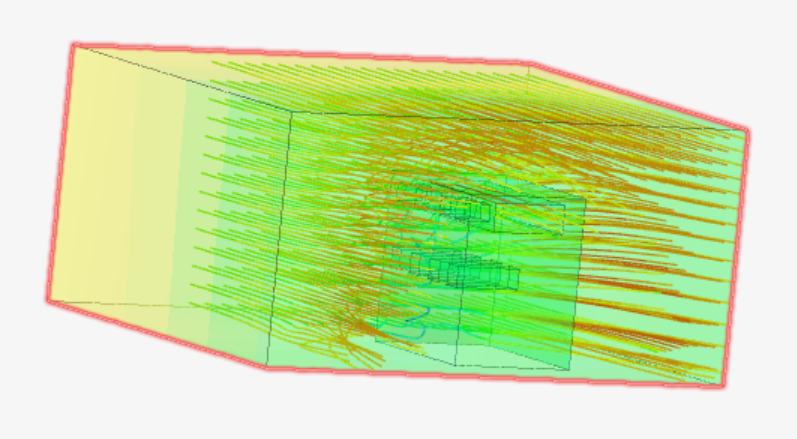
My name is Muhamad Azkhariandra Aryaputra, from Mechanical Engineering. This is the simulation CFD of the Microclimate of the 5-floor building of CCIT.
We want to know about how the wind is impacting this building through CFD simulation of the microclimate around this building
This is the first trial of the CFD Simulation
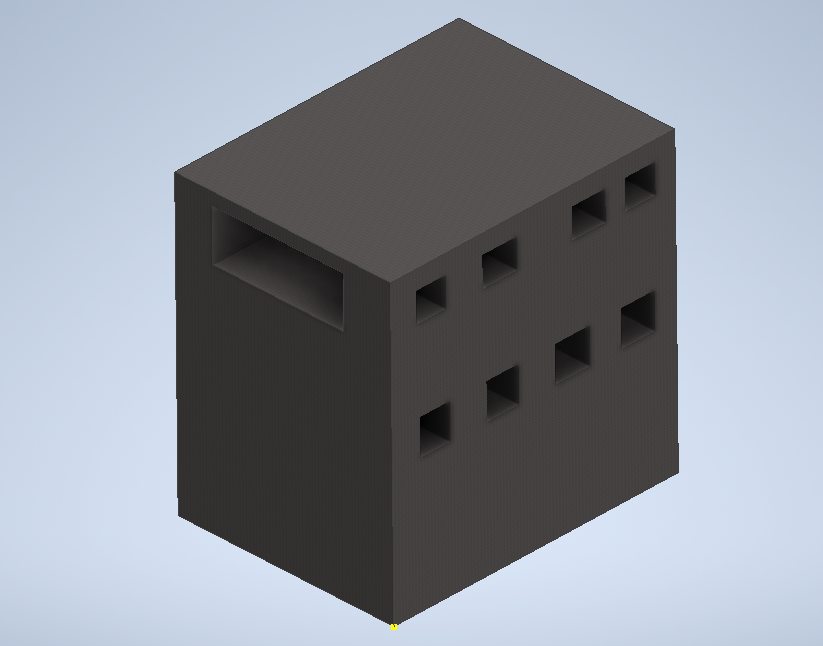
- The wind enters the domain with a velocity of 3 m/s, (regular wind speed In Depok)
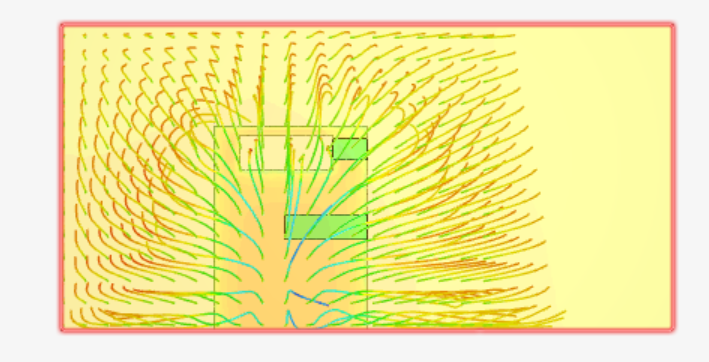
- It shows velocity magnitude, ranging from 0 to 5.329 m/s. The colors range from blue (low velocity) to red (high velocity).
- Low Velocity Zones:
- The areas behind the CCIT building (highlighted in blue and purple) indicate regions of low airflow velocity (close to 0-1 m/s). This suggests stagnation zones or recirculation due to obstructions.
- High Velocity Zones:
- Areas colored in green to yellow (around 2-3.2 m/s) are regions where the airflow is more streamlined.
- Some regions show velocity intensification, possibly due to the Venturi effect, where the flow accelerates through narrower gaps.
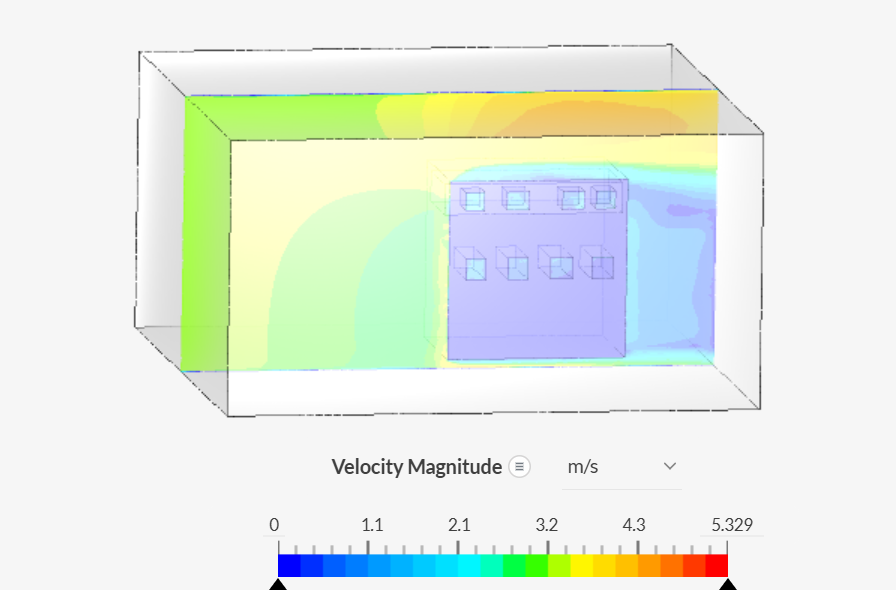
With the second trial, we got:
This CFD simulation illustrates the airflow velocity distribution within the CCIT building. The velocity magnitude ranges from 0 to 6.221 m/s, slightly higher than the earlier simulation, indicating local acceleration in this second trial. High-velocity zones, shown in orange and red, are concentrated in the upper-right section, where airflow accelerates, likely due to constriction or the Venturi effect. This suggests that the airflow is primarily channeled over the top of the internal structure, bypassing lower openings and accelerating as it passes through narrow gaps.
Conversely, low-velocity zones, represented in blue, are concentrated at the bottom left and behind the internal structures, indicating stagnation or recirculation zones with minimal airflow. This could result in poor ventilation and potential discomfort in those areas. Compared to the first simulation, this one shows a higher maximum velocity and more streamlined but uneven airflow distribution. The first case had a relatively broader airflow spread, whereas this simulation highlights a concentration of airflow in the upper sections, leading to poor penetration into the lower zones.
This uneven distribution poses several concerns. Poor ventilation in the lower sections could lead to air stagnation and thermal discomfort, while high-velocity regions at the top might result in localized discomfort or excessive cooling. it is recommended to modify the inlet design to achieve a more uniform airflow distribution, possibly by introducing guide vanes. Adding vertical deflectors inside the structure could help redirect airflow downward, improving ventilation in stagnant areas.
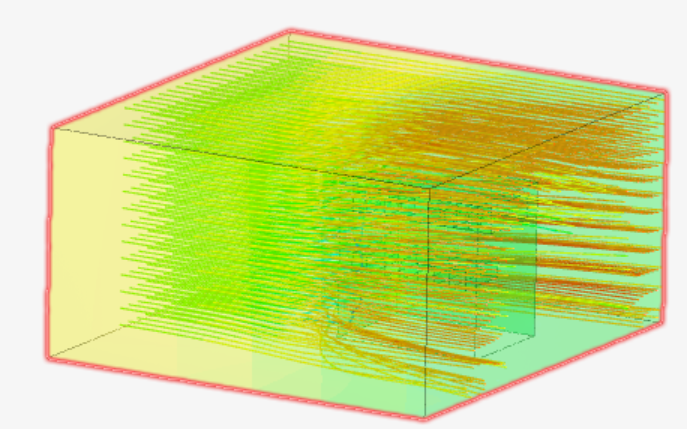
Based on the CFD simulations, the most suitable location for installing a wind turbine is in the upper-right section of the building, where the highest airflow velocities are observed. The simulations indicate that this area experiences wind speeds exceeding 5 m/s, ideal for efficient turbine operation.