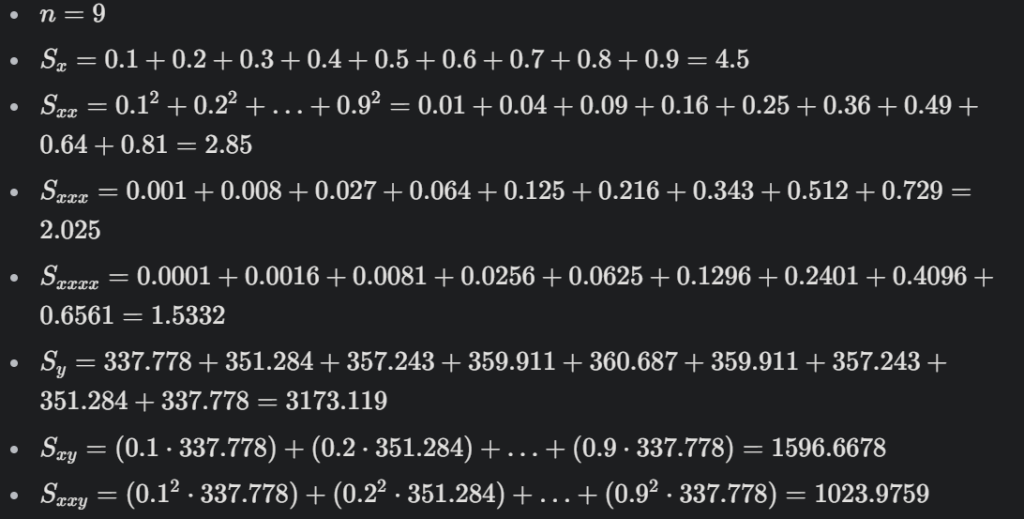
Analisis dan Pengolahan Data
- Persamaan
Matriks menjadi
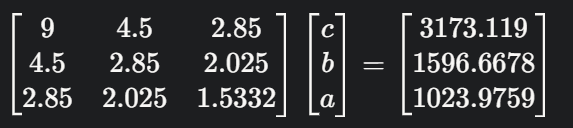
Dengan eliminasi Gauss kita dapat menemukan persamaannya menjadi :

- Curve fitting
Berikut merupakan coding javascript :
<!DOCTYPE html>
<html lang="en">
<head>
    <meta charset="UTF-8">
    <meta name="viewport" content="width=device-width, initial-scale=1.0">
    <title>Curve Fitting dengan Plotly.js</title>
    <script src="https://cdn.plot.ly/plotly-latest.min.js"></script>
    <style>
        body {
            font-family: Arial, sans-serif;
            display: flex;
            justify-content: center;
            align-items: center;
            height: 100vh;
            margin: 0;
            background-color: #f4f4f4;
        }
        #curveFitPlot {
            width: 800px;
            height: 600px;
            background-color: white;
            box-shadow: 0 4px 8px rgba(0, 0, 0, 0.1);
            border-radius: 8px;
        }
    </style>
</head>
<body>
    <div id="curveFitPlot"></div>

    <script>
        // Data dari file CSV
        const x = [0.1, 0.2, 0.3, 0.4, 0.5, 0.6, 0.7, 0.8, 0.9]; // Posisi (m)
        const T = [337.778, 351.284, 357.243, 359.911, 360.687, 359.911, 357.243, 351.284, 337.778]; // Temperatur (K)

        // Fungsi untuk curve fitting (polinomial derajat 2)
        function polynomial(x, a, b, c) {
            return a * x * x + b * x + c;
        }

        // Menggunakan metode least squares untuk curve fitting
        function curveFit(x, y) {
            const n = x.length;
            let sumX = 0, sumX2 = 0, sumX3 = 0, sumX4 = 0;
            let sumY = 0, sumXY = 0, sumX2Y = 0;

            for (let i = 0; i < n; i++) {
                sumX += x[i];
                sumX2 += x[i] * x[i];
                sumX3 += x[i] * x[i] * x[i];
                sumX4 += x[i] * x[i] * x[i] * x[i];
                sumY += y[i];
                sumXY += x[i] * y[i];
                sumX2Y += x[i] * x[i] * y[i];
            }

            const A = [
                [n, sumX, sumX2],
                [sumX, sumX2, sumX3],
                [sumX2, sumX3, sumX4]
            ];
            const B = [sumY, sumXY, sumX2Y];

            // Menyelesaikan sistem persamaan linear
            const coefficients = solveLinearSystem(A, B);
            return coefficients;
        }

        // Fungsi untuk menyelesaikan sistem persamaan linear
        function solveLinearSystem(A, B) {
            const n = A.length;
            for (let i = 0; i < n; i++) {
                // Pivoting
                let maxRow = i;
                for (let j = i + 1; j < n; j++) {
                    if (Math.abs(A[j][i]) > Math.abs(A[maxRow][i])) {
                        maxRow = j;
                    }
                }
                [A[i], A[maxRow]] = [A[maxRow], A[i]];
                [B[i], B[maxRow]] = [B[maxRow], B[i]];

                // Eliminasi
                for (let j = i + 1; j < n; j++) {
                    const factor = A[j][i] / A[i][i];
                    B[j] -= factor * B[i];
                    for (let k = i; k < n; k++) {
                        A[j][k] -= factor * A[i][k];
                    }
                }
            }

            // Substitusi mundur
            const X = new Array(n);
            for (let i = n - 1; i >= 0; i--) {
                X[i] = B[i] / A[i][i];
                for (let j = i - 1; j >= 0; j--) {
                    B[j] -= A[j][i] * X[i];
                }
            }
            return X;
        }

        // Melakukan curve fitting
        const coefficients = curveFit(x, T);
        const [a, b, c] = coefficients;

        // Menghasilkan data hasil curve fitting
        const xFit = [];
        const TFit = [];
        for (let i = 0; i <= 1; i += 0.01) {
            xFit.push(i);
            TFit.push(polynomial(i, a, b, c));
        }

        // Data untuk Plotly
        const data = [
            {
                x: x,
                y: T,
                mode: 'markers',
                name: 'Data Asli',
                marker: { color: 'blue' }
            },
            {
                x: xFit,
                y: TFit,
                mode: 'lines',
                name: 'Curve Fitting',
                line: { color: 'red' }
            }
        ];

        // Layout plot
        const layout = {
            title: 'Curve Fitting Data Temperatur',
            xaxis: { title: 'Posisi x (m)' },
            yaxis: { title: 'Temperatur (K)' },
            margin: { t: 40, b: 40, l: 50, r: 50 }
        };

        // Render plot
        Plotly.newPlot('curveFitPlot', data, layout);

        // Menampilkan persamaan hasil curve fitting
        console.log(`Persamaan Curve Fitting: T(x) = ${a.toFixed(2)}x² + ${b.toFixed(2)}x + ${c.toFixed(2)}`);
    </script>
</body>
</html>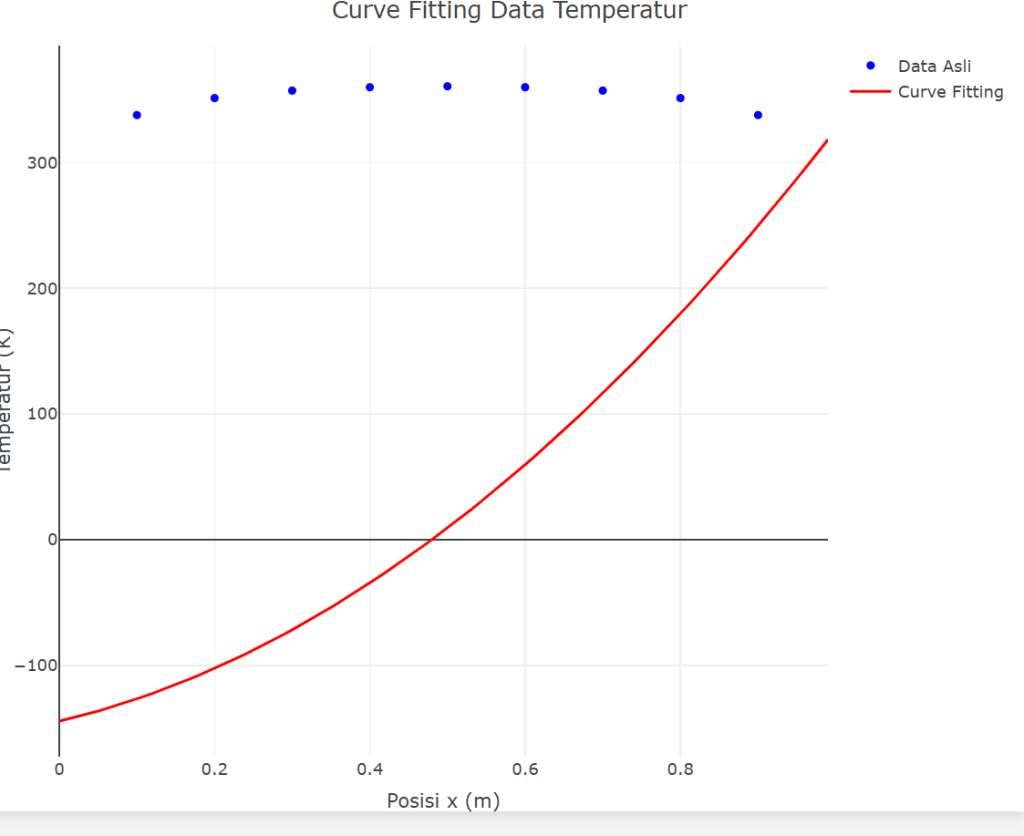
- Persamaan flux panas
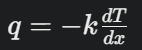
Dengan menggunakan turunan pertama terhadap x dari persamaan sebelumnya :
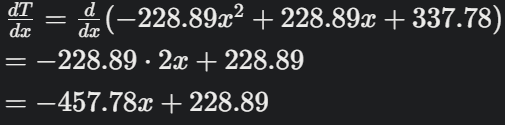
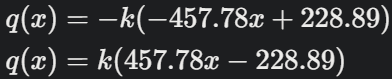
kita mendapatkan persamaan fluks panasnya yaitu :
- Menghitung daya
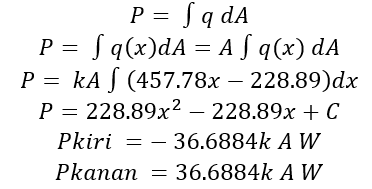
- Persebaran daya
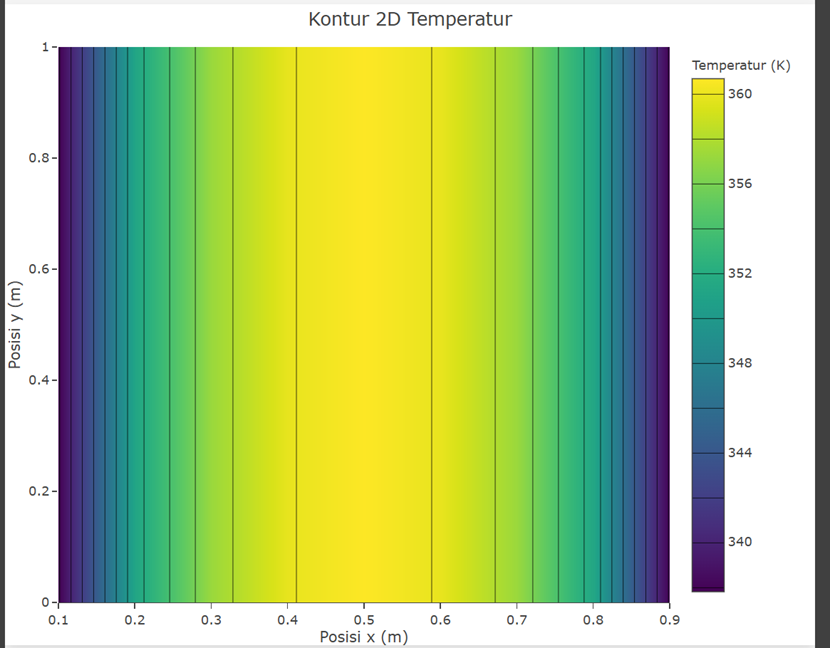
Energi panas (W)
- Sisi Atas = 0
- Sisi Bawah = 0
- Sisi Kiri = -18.31 W
- Sisi Kanan = 18.31 W
- Total = 36.62
<!DOCTYPE html>
<html lang="en">
<head>
    <meta charset="UTF-8">
    <meta name="viewport" content="width=device-width, initial-scale=1.0">
    <title>Kontur 2D Temperatur</title>
    <script src="https://cdn.plot.ly/plotly-latest.min.js"></script>
    <style>
        body {
            font-family: Arial, sans-serif;
            display: flex;
            justify-content: center;
            align-items: center;
            height: 100vh;
            margin: 0;
            background-color: #f4f4f4;
        }
        #contourPlot {
            width: 800px;
            height: 600px;
            background-color: white;
            box-shadow: 0 4px 8px rgba(0, 0, 0, 0.1);
            border-radius: 8px;
        }
    </style>
</head>
<body>
    <div id="contourPlot"></div>

    <script>
        // Data dari file CSV
        const x = [0.1, 0.2, 0.3, 0.4, 0.5, 0.6, 0.7, 0.8, 0.9]; // Posisi (m)
        const T = [337.778, 351.284, 357.243, 359.911, 360.687, 359.911, 357.243, 351.284, 337.778]; // Temperatur (K)

        // Membuat grid 2D
        const y = [0, 0.1, 0.2, 0.3, 0.4, 0.5, 0.6, 0.7, 0.8, 0.9, 1.0]; // Sumbu y (diasumsikan dari 0 hingga 1)
        const T_grid = [];

        for (let i = 0; i < y.length; i++) {
            T_grid.push(T); // Mengulang data temperatur pada sumbu y
        }

        // Data untuk Plotly
        const data = {
            x: x,
            y: y,
            z: T_grid,
            type: 'contour',
            colorscale: 'Viridis', // Skala warna
            contours: {
                coloring: 'heatmap' // Warna kontur
            },
            colorbar: {
                title: 'Temperatur (K)' // Judul colorbar
            }
        };

        // Layout plot
        const layout = {
            title: 'Kontur 2D Temperatur',
            xaxis: {
                title: 'Posisi x (m)'
            },
            yaxis: {
                title: 'Posisi y (m)'
            },
            margin: {
                t: 40, // Margin atas
                b: 40, // Margin bawah
                l: 50, // Margin kiri
                r: 50  // Margin kanan
            }
        };

        // Render plot
        Plotly.newPlot('contourPlot', [data], layout);
    </script>
</body>
</html>