1. The Model
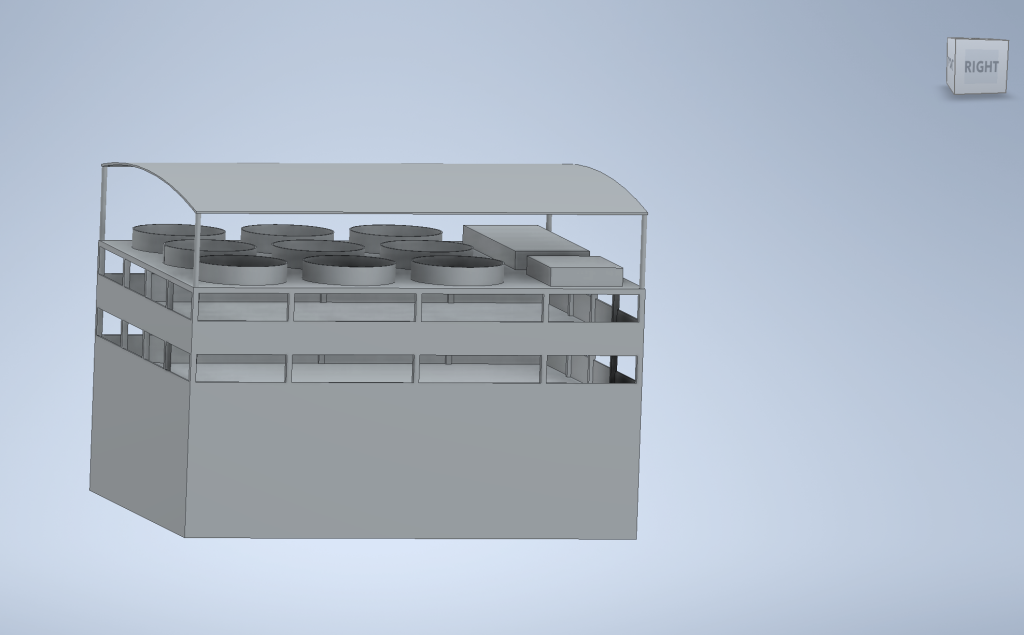
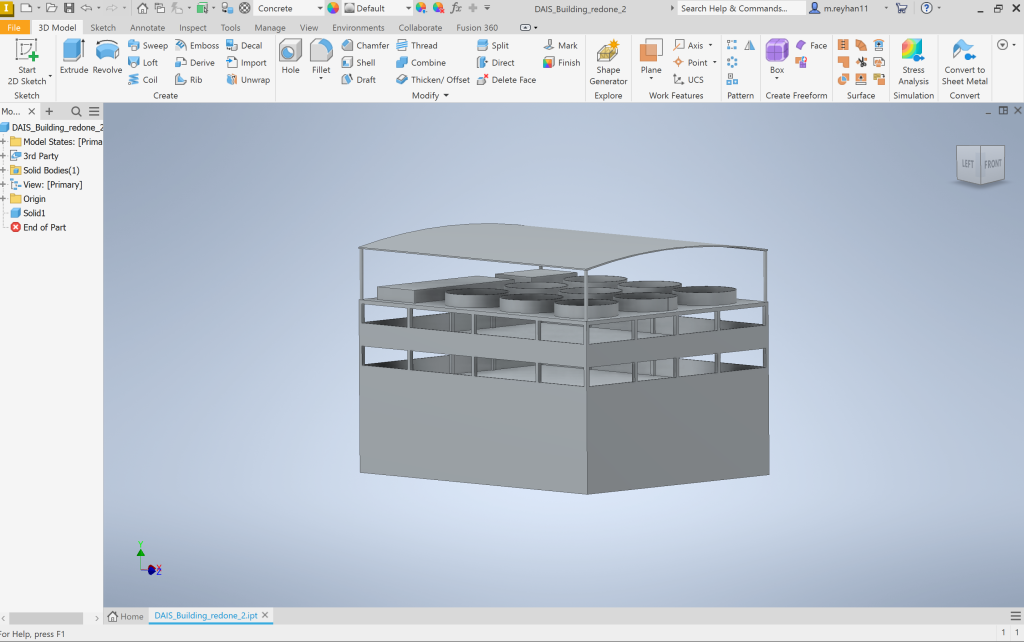
This 3D model that illustrates how the facility will be designed, with a 5 story high (the first 2 floors are for resident area, 3rd floor is for wool, bone, and meat processing, 4th floor is for sheep facility, and the 5th floor is for aquatics & agriculture facility). This model is designed in Autodesk Inventor Professional 2024.
2. Wind Flow Analysis

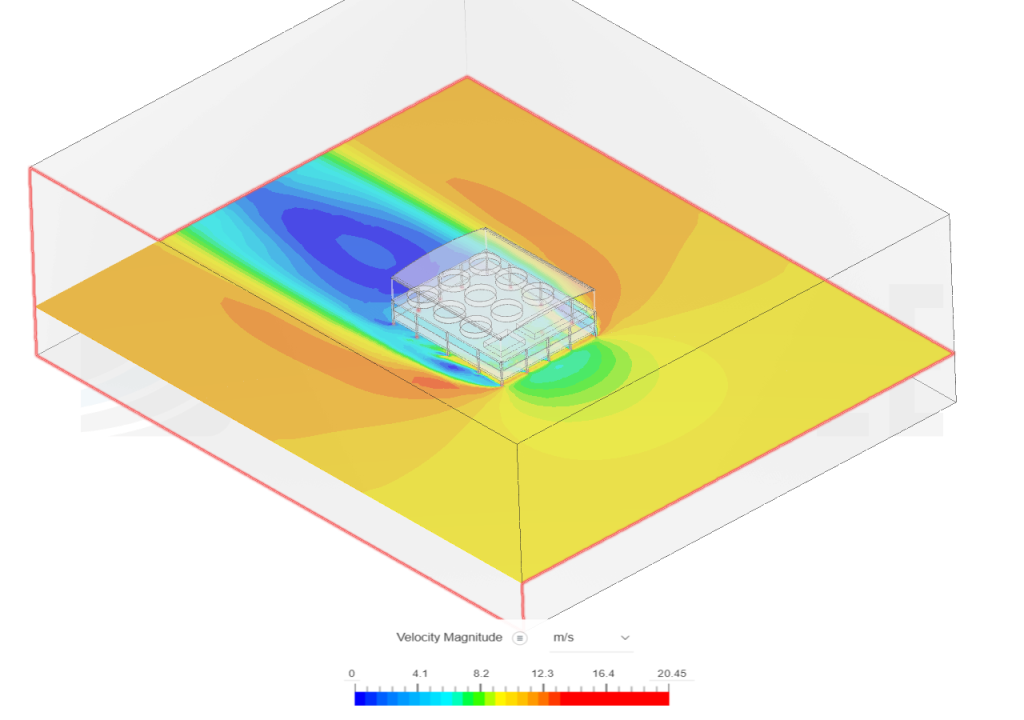
This pictures represents the results of a Computational Fluid Dynamics (CFD) wind analysis performed on a multi-purpose agricultural facility designed for sheep farming, Azolla cultivation, fish culture and sorghum. The objective of this study is to evaluate airflow patterns within and around the building to optimize ventilation and ensure an adequate environment for livestock and plant growth.
2. Simulation Setup
2.1 Software Used The analysis was conducted using SimScale, a cloud-based simulation platform that supports CFD, Finite Element Analysis (FEA), and thermal simulations. SimScale allows for efficient aerodynamic assessment of structures without requiring high-end local hardware.
2.2 Geometry and Model Description The structure analyzed is a semi-open agricultural building featuring an arched roof and multiple openings to facilitate natural ventilation. The computational domain is a rectangular enclosure representing the wind tunnel, ensuring an accurate simulation of real-world airflow conditions.
2.3 Boundary Conditions
- Inlet Wind Speed: 10m/s to simulate wind speed in Depok region in a windy-days
- Outlet Condition: Pressure outlet (ambient pressure)
- Walls and Roof: Considered as solid surfaces with no-slip boundary conditions
- Turbulence Model: Standard k-epsilon model for realistic airflow prediction
3. Results and Discussion
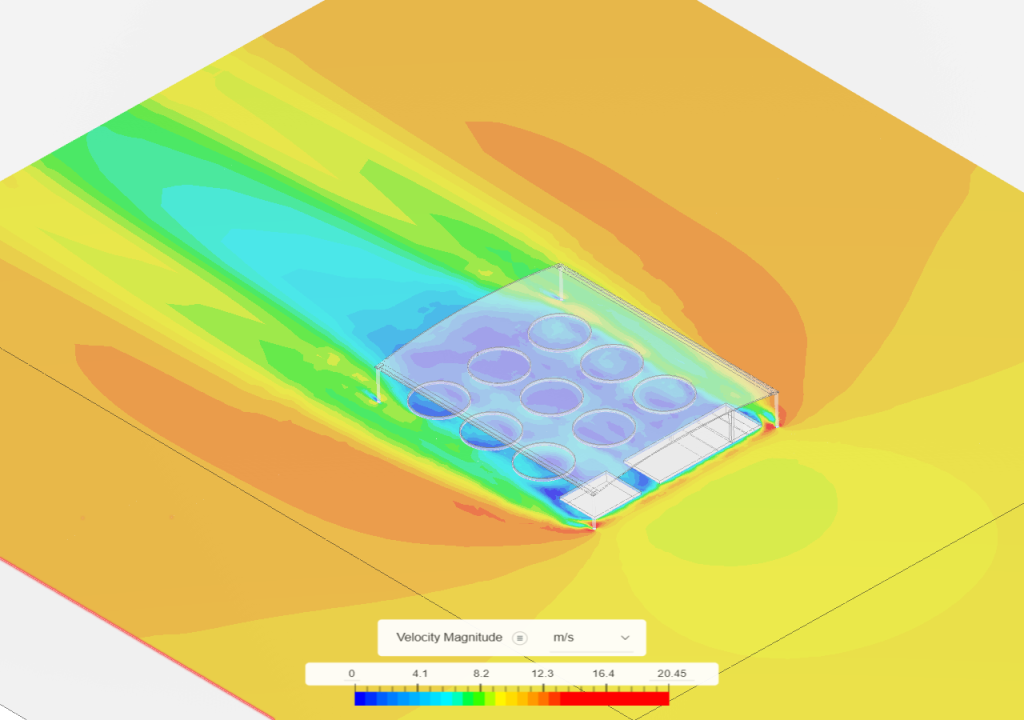
3.1 Velocity Distribution The simulation results, visualized in the velocity magnitude contour, indicate significant airflow variation throughout the structure:
- High-Velocity Zones (Red & Orange, 16.4–20.45 m/s): Found predominantly above and outside the structure, suggesting strong external wind forces.
- Moderate Velocity Zones (Yellow & Green, 8.2–16.4 m/s): Observed at the entry and exit points of the facility, facilitating cross-ventilation.
- Low-Velocity Zones (Blue, 0–4.1 m/s): Identified near the floor and interior sections, which may indicate stagnation zones requiring further design modifications for improved airflow.
3.2 Implications for Livestock and Plant Cultivation
- Sheep Farming: Proper ventilation ensures thermal comfort and reduces heat stress.
- Azolla Cultivation: Stable airflow can enhance CO₂ exchange and water evaporation rates.
- Tilapia Aquaculture: Consistent air movement supports oxygenation and temperature control of water bodies.
4. Conclusion and Recommendations The CFD analysis provides valuable insights into the airflow behavior within the agricultural facility. Key takeaways include:
- The current design supports cross-ventilation but may require additional ventilation openings at lower levels to mitigate stagnation.
- Structural modifications such as angled roof vents or adjustable louvers could optimize airflow for livestock and plant growth.
- Further studies, including thermal and humidity simulations, are recommended to complement airflow analysis for a environmental assessment.
This study demonstrates the effectiveness of CFD simulations in optimizing agricultural facility design, ensuring a healthier and more productive environment for DAIS.
3. Pressure Distribution Analysis
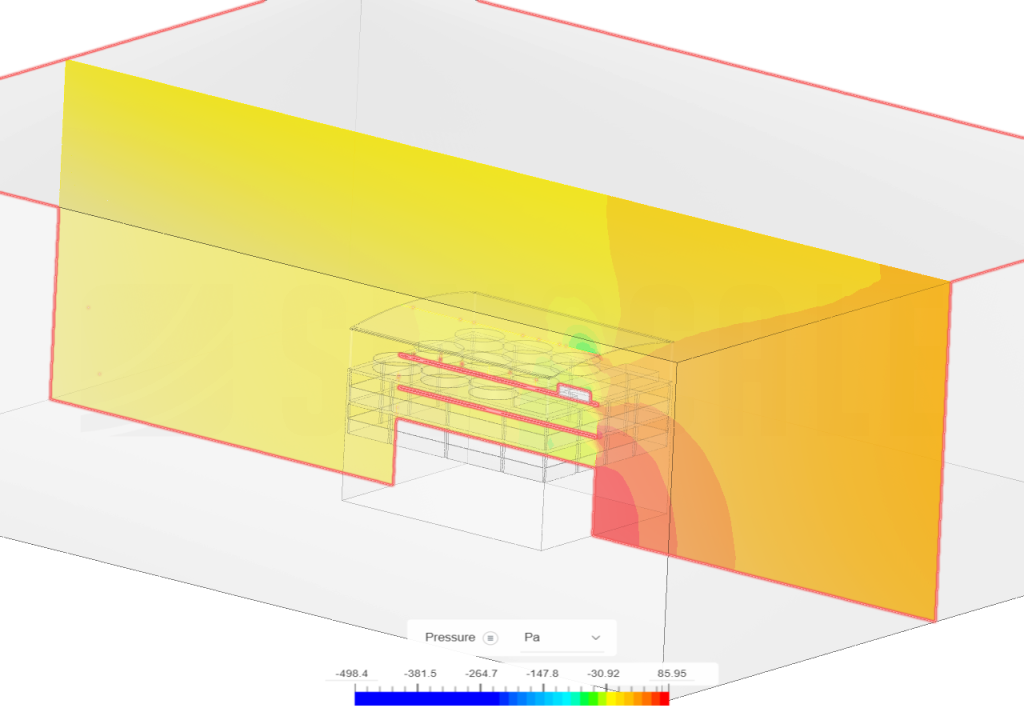
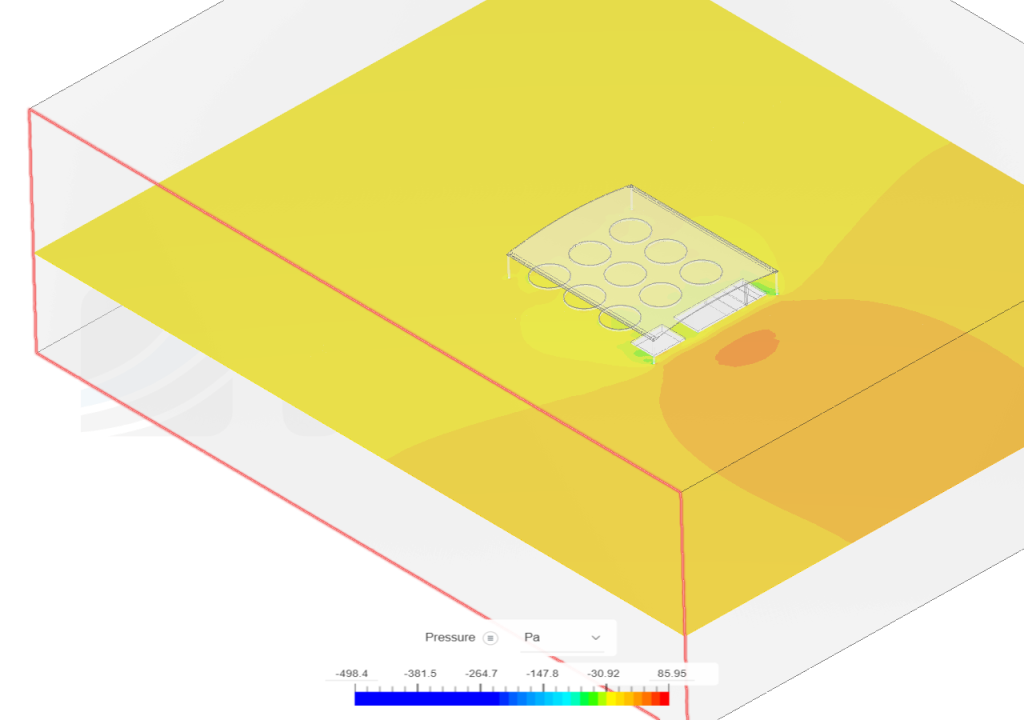
5.1 The simulation provides insight into how air pressure varies across the structure, influencing ventilation efficiency, air circulation, and the overall environmental conditions essential for maintaining optimal livestock and plant health.
5.2 The color gradient, ranging from deep blue to red, represents the pressure distribution in pascals (Pa). The blue regions signify areas of negative pressure, indicating zones where airflow accelerates or experiences a drop in static pressure. Conversely, yellow to red regions denote positive pressure zones where airflow encounters resistance or stagnation. The highest pressure levels are observed on the windward side of the structure, whereas negative pressure zones are concentrated around ventilation openings and regions where air accelerates due to structural interference.
From the visualization, it is evident that the facility experiences a pressure gradient across its volume. The presence of low-pressure zones near ventilation pathways suggests effective air extraction, potentially aiding in natural ventilation strategies. However, high-pressure zones, especially around obstructions or enclosed sections, may lead to areas of stagnant air, which could impact the thermal comfort of livestock and the efficiency of Azolla and fish farming operations.
5.3 The findings from this pressure distribution analysis provide valuable data for optimizing the facility’s ventilation system. Design modifications, such as adjusting vent placements or integrating passive airflow enhancements, could improve airflow uniformity and reduce unwanted pressure buildups. These optimizations are critical to ensuring an environment that supports livestock well-being and sustainable agricultural practices.
Written by: M. Reyhan Fachriansyah Hermawan 2106657172