
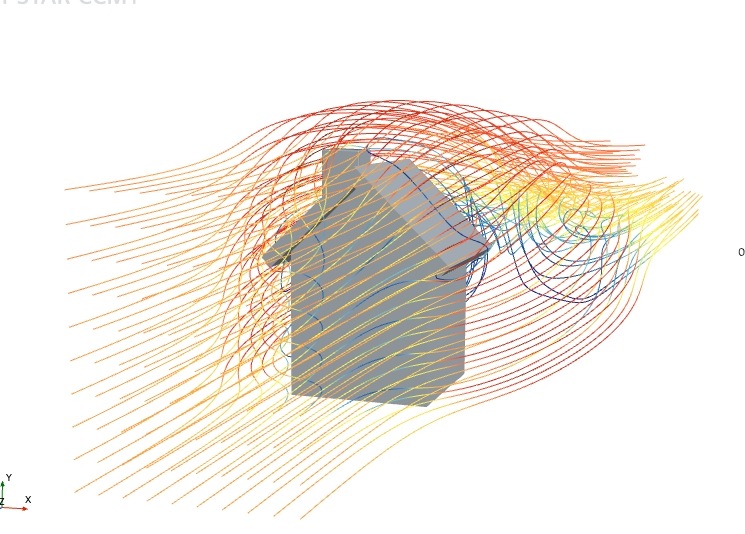
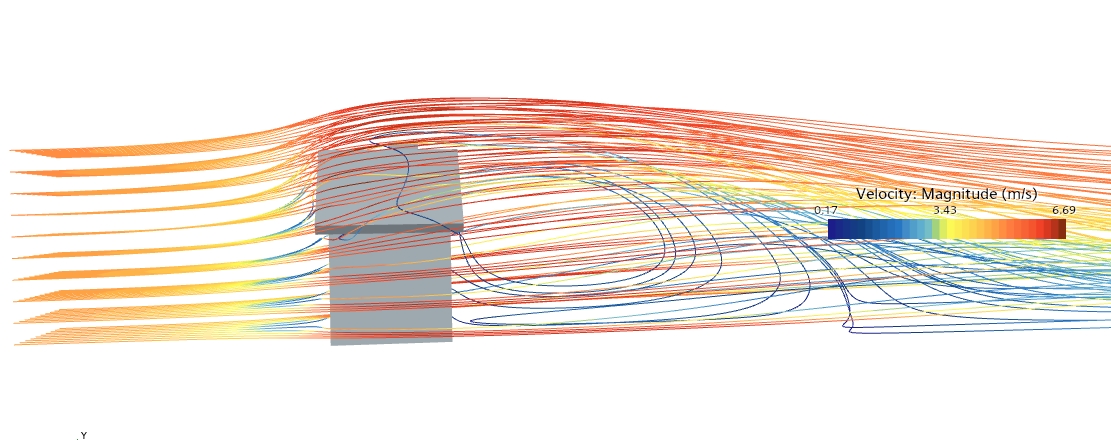
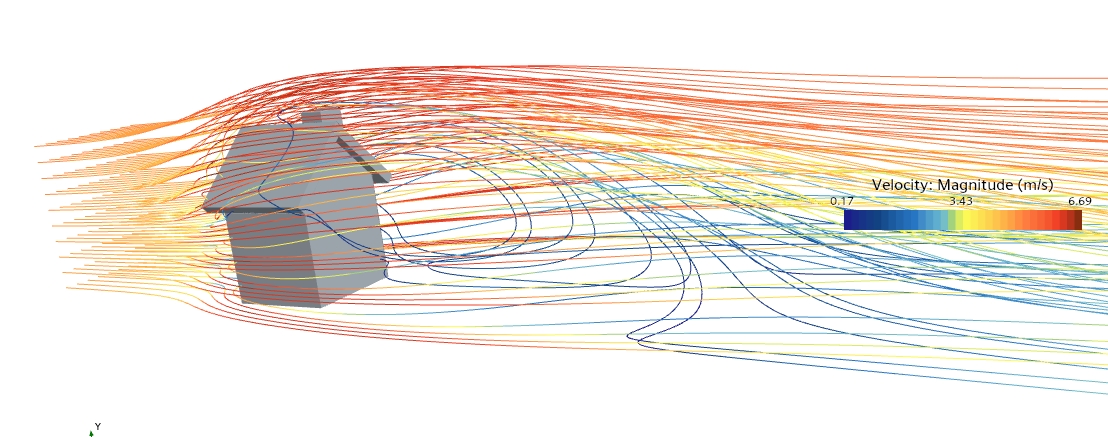
The airflow simulation illustrates a complex pattern around the building, focusing on velocity magnitude. The velocity scale progresses from blue to yellow to red, with values ranging from 0 to 6.45 m/s. Specifically, blue to yellow represents lower velocities (0 to 3.23 m/s), while yellow to red indicates higher velocities, reaching up to 6.45 m/s. The approach velocity of 3 m/s falls within the blue-to-yellow range, showing moderate airflow before accelerating around the structure.
As the air reaches the windward side of the building, it slows down, while flow acceleration occurs along the edges and through openings. The simulation highlights regions where velocity increases significantly, with values transitioning from yellow to red (3.23 to 6.45 m/s), indicating areas of intensified flow.
The airflow pattern suggests reduced velocity on the leeward side, with potential recirculation zones forming as the air moves around the structure. The vector lines show how the airflow separates and curves in these areas, indicating possible vortex formation.
The simulation also reveals horizontal stratification, where airflow behaves differently at various heights. Near the ground, interactions with the boundary layer create a more intricate flow pattern, whereas at higher elevations, the airflow stabilizes and gradually returns to its free-stream velocity of 3 m/s.